Download
1 / 53
530 likes | 683 Views
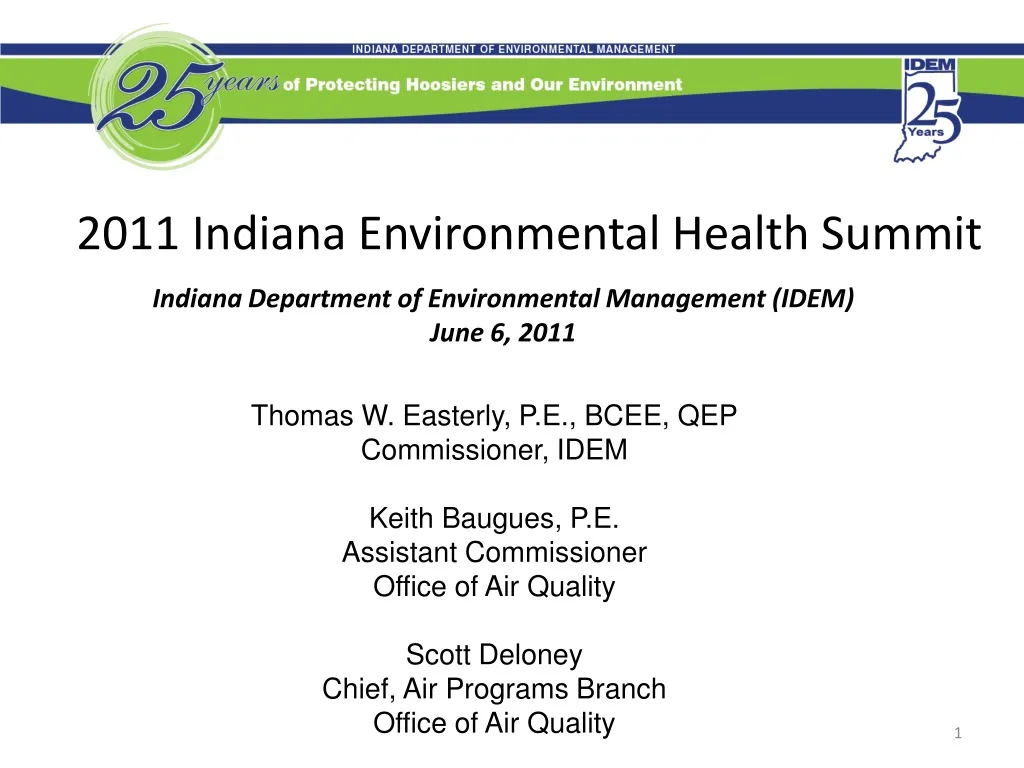
2011 Indiana Environmental Health Summit. Thomas W. Easterly, P.E., BCEE, QEP Commissioner, IDEM Keith Baugues, P.E. Assistant Commissioner Office of Air Quality Scott Deloney Chief, Air Programs Branch Office of Air Quality. Indiana Department of Environmental Management (IDEM)

E N D
2011 Indiana Environmental Health Summit Thomas W. Easterly, P.E., BCEE, QEP Commissioner, IDEM Keith Baugues, P.E. Assistant Commissioner Office of Air Quality Scott Deloney Chief, Air Programs Branch Office of Air Quality Indiana Department of Environmental Management (IDEM) June 6, 2011
Presentation Outline • Overview-IDEM’s Mission and Accomplishments (Commissioner Easterly) • Air Quality and Asthma Trends (Commissioner Easterly) • Air Quality Standards and Where Indiana Stands (K. Baugues) • Emission Trends (S. Deloney) • State and Federal Actions to Improve Air Quality (S. Deloney)
IDEM’s Mission We Protect Hoosiers and Our Environment IDEM’s mission is to implement federal and state regulations to protect human health and the environment while allowing the environmentally sound operations of industrial, agricultural, commercial and government activities vital to a prosperous economy.
How Does IDEM Protect Hoosiers and Our Environment? • Develop regulations and issue permits to restrict discharges to the environment to safe levels. • Inspect and monitor permitted facilities to ensure compliance with the permits.
How Does IDEM Protect Hoosiers and Our Environment? • Use compliance assistance and/or enforcement when people exceed their permit levels or violate regulations. • Educate people on their environmental responsibilities.
(573) (650) (385) (295) (597) (467) (Total Number of Title V Permits)
25 Years of Progress • At the end of 2009, for the first time since ambient air quality standards were developed, all of Indiana met all of the health based ambient air quality standards (including the 0.075 ozone standard). • During 2010, the new 0.15 microgram per cubic meter lead standard became effective and almost 700 people may be breathing air above that new standard. IDEM is working to make sure that those Hoosiers have clean air to breathe. • Outdoor Hydronic Heater (formerly Outdoor Wood Fired Boiler) Rule effective May 18, 2011. • Automotive mercury switch removal program.
National Ambient Air Quality Standards (NAAQS)Where Does Indiana Stand?
Criteria Pollutant TrendsStatewide: Lead • Carbon Monoxide • Particulate Matter • Nitrogen Dioxide • Ozone • Sulfur Dioxide
Indiana’s Nonattainment Area for Lead Based on 2007-2009 Monitoring Data October 15, 2008: U.S. EPA Established A New Lead Standard Set At 0.15 µg/m3 As A Three Month Rolling Average.
CO 1-Hour Design Values Based on 2010 Monitoring Data April 3, 1971:U.S. EPA Established A CO 1-Hour Standard Set At 35 ppm January 28, 2011: U.S. EPA Proposed To Retain The CO 1-Hour Standard At 35 ppm
CO 8-Hour Design Values Based on 2010 Monitoring Data April 3, 1971:U.S. EPA Established A CO 8-Hour Standard Set At 9 ppm January 28, 2011: U.S. EPA Proposed To Retain The CO 8-Hour Standard At 9 ppm
July 18, 1997: U.S. EPA Established A NewPM2.5 Annual Standard Set At 15 µg/m3 PM2.5 Annual Design Values (3-yr Average) Based on 2008-2010 Monitoring Data Standard at 15 µg/m3
March 15, 2010: U.S. EPA Announced It Would Reconsider The Annual PM2.5 Standard Within ARange Of 11-14 µg/m3 PM2.5 Annual Design Values (3-yr Average) Based on 2008-2010 Monitoring Data Standard at 13 µg/m3
March 15, 2010: U.S. EPA Announced It Would Reconsider The Annual PM2.5 Standard Within ARange Of 11-14 µg/m3 PM2.5 Annual Design Values (3-yr Average) Based on 2008-2010 Monitoring Data Standard at 11 µg/m3
Based on potential revisions to the 24-hour standard. PM2.5 24-Hour Design Values (3-yr Average of 98th Percentile) Based on 2008-2010 Monitoring Data Standard at 30 µg/m3
1-Hour Sulfur Dioxide (SO2) – Maximum 1-Hour Design Value Trends
SO2 1-Hour Design Values Based on 2008-2010 Monitoring Data Standard at 75 ppb June 6, 2010: U.S. EPA Announced A New SO2 1-Hour Standard Set At 75 ppb
Indiana Preliminary Designation Recommendations SO2 1-Hour Standard June 6, 2010: U.S. EPA Announced A New SO2 1-Hour Standard Set At 75 ppb
March 12, 2008:U.S. EPA Announced A New Ozone 8-HourStandard Set At 0.075 ppm Ozone 8-Hour Design Values (3-yr Average 4th High) Based on 2008-2010 Monitoring Data Standard at 0.075 ppm
Ozone 8-Hour Design Values (3-yr Average 4th High) Based on 2008-2010 Monitoring Data Standard at 0.070 ppm January 6, 2010: U.S. EPA Announced Reconsideration Of The Ozone 8-Hour Standard (Proposed Range Of 0.060-0.070 ppm)
Ozone 8-Hour Design Values (3-yr Average 4th High) Based on 2008-2010 Monitoring Data Standard at 0.065 ppm January 6, 2010: U.S. EPA Announced Reconsideration Of The Ozone 8-Hour Standard (Proposed Range Of 0.060-0.070 ppm)
Ozone 8-Hour Design Values (3-yr Average 4th High) Based on 2008-2010 Monitoring Data Standard at 0.060 ppm January 6, 2010: U.S. EPA Announced Reconsideration Of The Ozone 8-Hour Standard (Proposed Range Of 0.060-0.070 ppm)
Emission Trends: What is Influencing Air Quality Trends? (Central Indiana)
Central Indiana VOC Emission Trends Total VOC 89,881 Total VOC 68,692 Total VOC 54,141 Values are in Tons Per Year
Central Indiana NOx Emission Trends Total NOx 107,985 Total NOx 50,778 Total NOx 28,399 Values are in Tons Per Year
Central Indiana SO2 Emission Trends Total SO2 84,001 Total SO2 43,503 Total SO2 32,201 Values are in Tons Per Year
Central Indiana PM2.5 Emission Trends Total PM2.5 4,104 Total PM2.5 3,976 Values are in Tons Per Year
State and Federal Actions and Initiatives To Further Improve Air Quality
IDEM Initiatives to Support Future Air Quality Improvement Stage 1 vapor recovery (statewide) (LSA#07-353)-Effective Consumer and commercial products (LSA#07-351)-Final Adopted 9/10 Architectural and industrial maintenance (AIM) coatings (LSA#06-604)-Final Adopted 9/10 Outdoor hydronic heaters (LSA#05-332)-Final Adoption 3/2/2011 Automobile refinishing operations (LSA#06-603)-Effective DieselWise Indiana and VIP