Download
1 / 20
280 likes | 638 Views
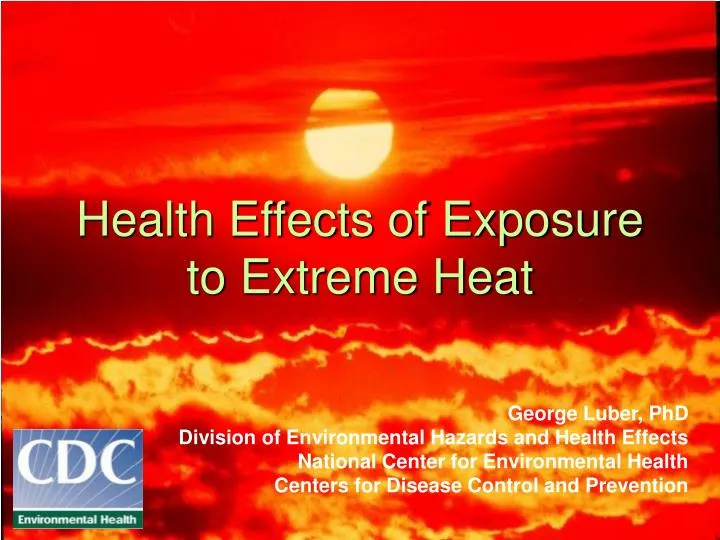
Health Effects of Exposure to Extreme Heat. George Luber, PhD Division of Environmental Hazards and Health Effects National Center for Environmental Health Centers for Disease Control and Prevention. Presentation outline. An overview of the epidemiology of heat waves

E N D
Health Effects of Exposure to Extreme Heat George Luber, PhD Division of Environmental Hazards and Health Effects National Center for Environmental Health Centers for Disease Control and Prevention
Presentation outline • An overview of the epidemiology of heat waves • The impact of climate change on extreme heat exposure • Current CDC activities
Heat Waves • High mortality • More deaths than hurricanes, lightning, tornadoes, floods, and earthquakes combined. • From 1999–2003, total of 3,442 reported heat-related deaths. Annual mean of 688 (MMWR 2006) • Lack of public recognition • No damage to infrastructure (silent killer) • Many deaths go unreported or unattributed • Every death is preventable
Heat Wave Studies 1980 St. Louis • 1st to highlight the magnitude of mortality from heat waves • All cause mortality increased 57% 1993 Philadelphia • Identified cardiovascular mortality as a major cause of death associated with extreme heat 1995 Chicago • Redefined heat-related death as used by medical examiners • Assisted with the development of a Heat Wave Response Plan
2 day lag MMWR 1995
Heat Wave Studies 2003 France • 34,000+ dead in Europe • 14,000+ dead in France • Many were elderly in nursing homes • No effective method to cool
Individual Community Characteristics Lessons Learned Risk factors for hyperthermia: • Age • Underlying medical conditions / mental illness • Income and poverty status • Homelessness • Social isolation • Access to health care and cooling facilities • Neighborhood characteristics: land use/ land cover, crime rate, housing type, urban heat island
Curriero et al. 2002 Temperature-mortality relation for 11 US cities, 1973–1994
Climate Change Predictions Intergovernmental Panel on Climate Change (IPCC): “Cities that currently experience heat waves are expected to be further challenged by an increased number, intensity and duration of heat waves during the course of the century.” [very high confidence]
July Heat Index Change -- 21st Century • A July day in Atlanta that now reaches a heat index of 105°F would reach a heat index of 115°F in the Hadley model, and 130°F in the Canadian model. Map by B. Felzer, UCAR, based on data from Canadian and Hadley modeling centers.
Urban “built” environments • Cities and climate are coevolving in a manner that will place more populations at risk. • Increase in vulnerable populations: • Today, more than half of the world’s population lives in cities, up from 30% in 1950. • By 2100 there will be 100 million more people > 65 years old (relative to 2000) (Ebi et al. 2006). • Urban heat islands
Urban Heat Island can add 7° – 12° F Thermal Satellite Image of Phoenix, AZ Night Surface Temperature
Mean Summertime Temp (F) Heat Wave Temp (F) 106°F 118°F 99°F 104°F Neighborhood Microclimates within the UHI • Slide on the Phoenix neighborhood study Harlan et al 2006
CDC activities • Guidance on the development of city-specific heat response plans • Vulnerability mapping using remote sensing
Excessive Heat Events (EHE) Guidebook • City-specific heat response plans • The guidebook: • EPA, NOAA, CDC, FEMA collaboration • Options for defining EHE conditions • How to assess local vulnerability • EHE notification and response actions that work
Vulnerability Mapping using Remote Sensing Objective: “to develop a new research methodology that provides local and regional governments a new set of skills and tools in prevention and emergency response planning for acute and chronic urban climate impacts.”
Identify Vulnerable Neighborhoods Heat-related medical incidents Sorted spatially and temporally
Layers of Vulnerability / Risk Factors Layers include: - Surface temp - Land cover - Power Outages - Demographic variables - Housing stock - Engineered materials
Final thoughts: • Morbidity and mortality related to summer heat can prevented. • Adaptation measures such as city-specific Heat Response Plans are essential for prevention. • Epidemiologic studies and ecological models of risk provide important guidance for prevention efforts.