Download
1 / 84
840 likes | 1.11k Views
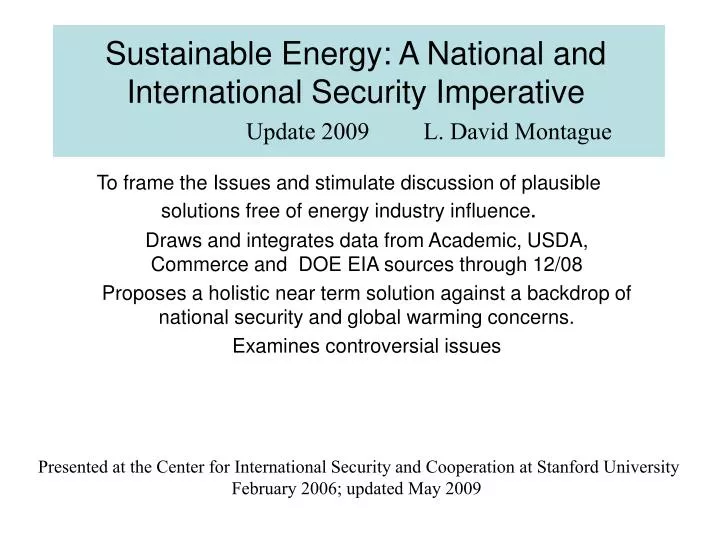
Sustainable Energy: A National and International Security Imperative. Update 2009 L. David Montague. To frame the Issues and stimulate discussion of plausible solutions free of energy industry influence .

E N D
Sustainable Energy: A National and International Security Imperative Update 2009 L. David Montague • To frame the Issues and stimulate discussion of plausible solutions free of energy industry influence. Draws and integrates data from Academic, USDA, Commerce and DOE EIA sources through 12/08 Proposes a holistic near term solution against a backdrop of national security and global warming concerns. Examines controversial issues Presented at the Center for International Security and Cooperation at Stanford University February 2006; updated May 2009
Outline of Discussion • Current and projected US and World energy consumption and supply by sector • Carbon emissions and warming • The nature of the options & issues • Transportation • Bio-fuels • Hydrogen, Fuel Cells • Electric Power • Solar, Wind, • Bio-fuels, • Nuclear • A proposed quantifiable solution set for near and long term sustainable energy independence
Energy use grows with economic development energy demand and GDP per capita (1980-2002) US Australia France Russia S. Korea UK Japan Ireland Greece Malaysia Mexico China Brazil India Steven Koonin • Source: UN and DOE EIA
energy demand – growth projections Global energy demand is set to grow by over 60% over the next 30 years – 74% of the growth is anticipated to be from non-OECD countries Global Energy Demand Growth by Region (1971-2030) Energy Demand (Mtoe) Notes: 1. OECD refers to North America, W. Europe, Japan, Korea, Australia and NZ 2. Transition Economies refers to FSU and Eastern European nations 3. Developing Countries is all other nations including China, India etc. Source: IEA World Energy Outlook 2004
growing dislocation of supply & demand • N. America, Europe and Asia Pacific are the three largest demand centres • But, have a small share of the remaining oil and gas reserves; coal is the exception • Their collective shares are: • Oil - 80% of demand; 15% of conventional reserves (28% incl. unconventional reserves) • Gas – 61% of demand; 32% of reserves • Coal – 89% of demand; 69% of reserves Steven Koonin
CO2emissions and GDP per capita (1980-2002) US Australia Russia Ireland UK S. Korea Japan France Greece Malaysia Mexico China Brazil India • Steven Koonin
The Oil Problem Nations that HAVE oil Nations that NEED oil (% of Global Reserves) (% of Global Consumption) Saudi Arabia 26% Iraq 11% Kuwait 10% Iran 9% UAE 8% Venezuela 6% Russia 5% Mexico 3% Libya 3% China 3% Nigeria 2% U.S. 2% U.S. 26% Japan 7% China 6% Germany 4% Russia 3% S. Korea 3% France 3% Italy 3% Mexico 3% Brazil 3% Canada 3% India 3% Source: EIA International Energy Annual
Petroleum supply, consumption, and imports, 1970-2025 (million barrels per day) 65%
Key Issues • Are we running out of oil? • Do we have plenty of natural gas reserves? • Is Hydrogen created by renewable electricity burned in fuel cells the right solution for clean transportation energy? • Can biofuels -- especially ethanol -- ever realistically eliminate the need for imported oil without a major impact on food costs and land use? • Can renewable wind and solar generated power with conservation meet our electricity needs? • Nuclear power plants are seen as unsafe, inefficient and expensive and their radioactive waste will pollute the planet for thousands of years. And what about weapons grade fissile material? • Can clean energy be made economically from coal with the CO2 sequestered by pumping it underground?
Are we running out of oil?We are certainly running out of cheap oil. Productivity of easily accessible oil reserves are is waning. Hence the assessment that the peak in supply has already occurred. If worldwide demand for oil continues to grow, the price of oil will continue to increase. As the price increases, large more expensive and energy intensive “unconventional” reserves become economically viable if consumers are willing to pay that price. Even so, this simply postpones the inevitable depletion of oil resources, and exacerbates greenhouse emissions.
Oil & Gasoline Market Behavior • The oil market is not a free market • Demand is inelastic and growing while supply is elastic as long as reserves exist • The supply pipeline is easily manipulated or disrupted • Demand inelasticity vs supply pipeline vulnerability encourages speculation and no relation to actual cost • There is no incentive for oil companies to put downward pressure on oil prices, because profits rise directly with crude price • Then there is the “Mysteresis” effect. Gasoline prices at the pump rise instantly with crude increases but lag significantly as crude prices go down. In reality the pipeline is weeks long and refiners rarely contract at the delivery day spot price.
Have We Plenty of Natural Gas? Maybe, but.... • If so why are we importing 25% now soon to be 30%? • And why are the energy companies clamoring to build LNG terminals to bring in more from the same countries that now are part of the oil cartel? 17
Approximate Trade Deficit Contribution of Crude Oil And Natural Gas Imports Sources: Dept of Commerce BEA and Dept of Energy EIA Crude Oil and Natural Gas Imports Now Make Up 55% of The Trade Deficit
Vectors Are in The Wrong Direction • Growing reliance on unreliable foreign supply of energy presents an unacceptable threat to our national security and economic stability • China’s 10% annual growth along with other developing countries will worsen the pressures on oil and gas supply and prices. • We are increasingly vulnerable to economic disruption due to gas and oil supply interruption • The off-shore profits help fund terrorist and fundamentalist regimes that could cause that interruption • Increased greenhouse gas emissions • Enacted energy legislation does little to alleviate the problem - time line is incompatible with the need • There must and can be effective competitive energy sources to oil and gas suppliers that also reduce carbon emissions
Is Hydrogen burned in fuel cells an answer for clean transportation energy? While hydrogen occurs abundantly in hydrocarbons and water, much more energy is required to liberate distribute and store the hydrogen than it delivers. Storing the variable output from renewable wind and solar generated electricity as hydrogen from water to supply fuel cells in electric vehicles sounds attractive since the electricity for disassociation is unlimited and “free”. However…….
Fuel Cell System TrendsCompared with other Distributed Generation Technologies 70 Combined Cycle 60 Carbonate Fuel Cell Solid Oxide Fuel Cells 50 Electrical Generation Efficiency %LHV PAFC Aero Gas Turbines 40 PEM Fuel Cell 30 Industrial Gas Turbine 20 IC Engines Stirling Engine 10 Microturbines 0 1 10 100 1,000 10,000 100,000 500,000 Residential Commercial Industrial Wholesale Size in kW Copyright 2005 Electric Power Research Institute,Inc All rights reserved
“Free” Electricity 100Kw Electrolysis 75% 75Kw 75Kw Condition 90% 75Kw Gas H2 FC Output Leveler Gas H2 FCEV 90Kw LH2 FCEV Grid 85% Compress 90% Liquify 65% Compress & Store 85% 77Kw 67Kw 49Kw End User Distribute 80% Xport & Store 85%** 64Kw 54Kw 34Kw Fuel Cell 65% Xfer & Store. 90%* 41Kw 49Kw 42Kw Fuel Cell 40% Fuel Cell 40% DC to AC & Step-up 95% Grid 85% 16Kw 20Kw 40Kw Propulsion 90% Propulsion 90% * Pipeline and tank leakage with time **4% boil off per day 15Kw 17.6Kw RENEWABLE ELECTRICITY DELIVERY WITH H2 AS CARRIER
Hydrogen Bottom Line • Most commercial hydrogen is made by energy intensive steam reformation of natural gas which we have to import. • Using variable wind and solar generated electricity to produce hydrogen from water is a losing proposition. • Facility investors want the best return on their investment. • Using the electricity directly is much more efficient reducing carbon emissions much more by displacing hydrocarbon fired electricity generation. • Storing and distributing that energy is the problem. • Hydrogen is a diversion • without merit for earthly transportation.
What About Ethanol? • Ethanol takes more energy to make it than it delivers • Ethanol has lower energy content than gasoline so it is a poor fuel choice - 77,000 vs 116,300 btu/gal • Ethanol costs much more per mile than gasoline • Engines require redesign/modification to burn ethanol • Ethanol production and distribution cannot be increased rapidly • Most ethanol currently being produced is from corn which is unsustainable without seriously degrading the food supply. Diversion of food crops to bio-fuel already is the primary cause of increased food shortages and dramatically higher food prices • Growing the feedstock for enough ethanol to eliminate dependence on imports requires more arable land than exists in the US • Growing bio-fuel feedstock depletes nation’s fertile soils.
1 acre of corn yields enough ethanol (≥365 gal.) to run a full sized hybrid vehicle for 12K mi (the average driven during a year) at 48 mph.
2nd Generation Hybrid Vehicle Proposed For Long Term • Uses 35 average hp flex fuel engine to overcome drag and rolling friction and battery charging relying on battery power for acceleration at highway speeds as well as low speed operation. Plug in capability desireable. • Requires more batteries with high energy density, high surge current capability, and long cycle life. • Lithium Ion nanoelectrode battery technology appears most promising solution with potential for: • Many thousands of cycles with electrodes not susceptible to fatigue failure • High current capable, fast recharging • Good ruggedness and safety But not yet mature in required sizes.
How Much Ethanol to Run Half of all US Cars if They Were Hybrids as Proposed? • A Ethanol fueled IC engine running at 35 hp augmented by battery usage for acceleration with regenerative braking is adequate for hybrid full size family vehicles • to run 100 million hybrid cars for 12K miles at 48 mph on ethanol would take 365 gal. X100 X106 or 36.5 billion gallons of ethanol/yr. US in 2008 produced about 9.2 billion gal/yr of ethanol
US Retail Regular Gasoline Oct 08 - Dec 08 - Sep 08 - Nov 08 -
How Much Biomass and Land to Grow and Transform to Ethanol? • If it all came from corn: • Corn Crop yield ≥140 bushels per acre, and 2.6 gal of ethanol/bushel at least 365 gal of Ethanol per acre • 36.5 x 10⁹ gal./365 gal./acre = 100 million added acres planted in corn compared to about 94 million acres currently in corn for all purposes • But, other feed stocks offer large alternate sources • Sugar beets have a much higher yield per acre and crop could easily be increased ten fold. • Molasses by-product from sugar production also is attractive feed stock • Cellulosic/Algae process brings large additional supply later • Since conversion process temperature is < 120ºC, “free” waste heat from electric generating power plants or solar boilers can be used.
USING WASTE HEAT FROM POWER PLANTS FOR ETHANOL PRODUCTION • 40 Quads of input energy used in 2007 to generate 13.6 Quads of electricity for 33% average efficiency • Even if average efficiency improved to 50% (which it could and should to reduce natural gas consumption) the amount of waste heat would still be 20 x1015 BTU. • If ethanol plants were co-located with the power plants, that waste heat could be used at 35% efficiency to produce enough ethanol for 335 million hybrid cars and light trucks -- 42% more than currently registered in US • 7 x 10¹⁵ less BTUs dumped into the environment
Claim: Ethanol produced from corn -- unsustainable without seriously degrading the food supply. Diversion of food crops to bio-fuel already is the primary cause of increased food shortages and dramatically higher food prices Finding: In 2008 the average price of corn was between $4 and $5/bu. even though ethanol production grew to 9.2 billion gallons. The midyear spike in corn prices to $8 was due to speculation based on export demand stimulated by the decline in the dollar vs other currencies, spring flooding in the midwest, increased farm fuel costs, as well as anticipated additional bio-fuel demand Claim: Growing corn for enough ethanol to eliminate dependence on imports requires more arable land than exists in the US Finding: False, and based on faulty assumptions- i.e. no concurrent actions such as hybrid vehicles. 35
Ethanol Yields & Costs For Key Feedstocks - 2005 *Bi-product of sugar production Source: USDA
States Growing Sugar Beets & Cane Sugar Beets Sugar Cane
Key US Feedstock Production 1 2008 yield is 153.9 bu/acre 2 2008 total crop is 12.01B. 3 Sugar production bi-product Source USDA
THE PROMISE OF SWITCHGRASS (1) Bio-ethanol to Hybrid Vehicle vs. Bio-electricity to EV Plant, grow, dry & harvest 1 acre of Switchgrass 1.8 MBTU Transmission to and charging EV Battery @80% eff 0.2 MBTU 17.5 MBTU 14 MBTU Battery & Electric Motor 90% eff. Burn to generate Electric power @35% eff. Tranport and Pelletize Dried biomass 50 MBTU 4 Tons of Dried Switchgrass @12.4 MBTU/ton 12.6 MBTU Energy to Wheels < 0.1 MBTU 2.45 MBTU 1.4:1 Transport & Conversion To Ethanol 400 gal. @ 77 KBTU/gal. 8.78 M8TU Energy to Wheels Distribution 30.8 MBTU Hybrid Internal Combustion Engine @ 28.5% eff.
Ethanol Mythology and Reality • Ethanol takes more energy to make it than it delivers • Depends how you allocate energy cost to bi-products • The argument is moot since all the energy for production can be power plant waste heat or otherwise wasted incident solar radiation • Ethanol has lower energy content than gasoline so it is a poor fuel choice - 77,000 btu/gal 116,300 vs for gasoline. • Ethanol burns slower and more efficiently in an IC engine regaining about half of the difference due to energy content. • Ethanol costs much more per mile than gasoline • A gallon of Ethanol has generally averaged about 75% the cost of gasoline in California - about the difference in mileage per gallon • Engines require redesign/modification to burn ethanol • Many engines in currently produced US cars are flexible fuel engines that can burn any blend from pure gasoline to at least 90% ethanol • Ethanol production and distribution cannot be increased rapidly • Existing gasoline distribution except pipelines can be readily used for ethanol and production facilities can and are growing to meet increased demand.
Butanol vs Ethanol* • Issues • High temperature Oxo syn gas production process has negative energy balance. • ABE Bio-process is currently slow and requires more energy than ethanol production* • Neither appear applicable to small operations like farm cooperatives • Ethanol process from starch/sugar is mature and less esoteric • Ethanol yields more btu/bu of transportation fuel than Butanol Advantages • higher energy content than ethanol • Much less miscible with water -storable and transportable via pipelines • Lower vapor pressure • H2 created as a byproduct • Two production processes -syn gas and microbial • BP, DuPont and others working on higher efficiency bio reactor processes
Butanol vs. Ethanol* • Corn-based butanol, produced by means of the current ABE process, could offer substantial fossil energy savings and moderate reductions in Green House Gas (GHG) emissions relative to petroleum gasoline on a WTW basis, when co-products are credited by energy allocation. • The energy benefits associated with bio-butanol are significant when co- product corn-acetone is credited with displacement method. • When acetone is credited by energy allocation, life-cycle energy benefits for corn butanol are less promising than those of corn ethanol generated from conventional dry milling processes. GHG emissions generated from bio- butanol life cycle are higher than those generated from corn ethanol. • From a liquid fuel production standpoint, the ABE process examined may not be as effective as conventional corn ethanol production in that it produces less liquid fuel (on an energy basis) per bushel of corn than the corn ethanol process, in addition to increased process fuel use in the production plant. • The impacts of corn-acetone (produced via the ABE process) on the acetone market need to be carefully examined, and new uses for bio-acetone need to be explored. * Conclusions of Argonne National Laboratory entitled Life Cycle Assessment of Corn-Based Butanol as a Potential Transportation
Bio-fuels & Hybrids in Transportation Can Eliminate our need for imported oil • We grow things better than any nation on earth • Biomass (corn, sugar cane and beets, sorgum, fruit, cellulose algae and many other waste products) are logical feed stock for bio-fuels. • CO2 can be reduced by at least 30% using ethanol and more is absorbed in growing the biomass. • Flex-fuel Hybrids double miles/gal. and allow a smooth transition to oil independence. Electric Vehicles Help. • Arguments about ethanol life cycle net energy balance are moot if biomass is converted using waste heat from power plants, or the sun’s energy.
PART 2 SUSTAINABLE ELECTRIC POWER
Can Solar and Wind Energy Provide The Clean Electricity we Need? • Proliferation of reasonably priced distributed 3 kw PV systems • Solar thermal distributed systems • Large Solar Thermal facilities • Large hybrid PV/thermal facilities • Large scale wind energy
NM Electricity Demand Over 24 Hrs. Compared With Solar Flux 6.5 GW 7.2 GW Winter demand Summer demand Solar flux relative to Peak flux Source: LANL 1663 Article
Best Research-Cell Efficiencies Sam Baldwin Chief Technology Officer Office of Energy Efficiency and Renewable Energy U.S. Department of Energy Spectrolab 36 Multijunction ConcentratorsThree-junction (2-terminal, monolithic)Two-junction (2-terminal, monolithic) Crystalline Si CellsSingle crystalMulticrystallineThin Si Thin Film TechnologiesCu(In,Ga)Se2CdTeAmorphous Si:H (stabilized) Emerging PVDye cells Organic cells(various technologies) Spectrolab Japan Energy 32 NREL/ Spectrolab NREL NREL 28 UNSW UNSW 24 UNSW Spire UNSW NREL Cu(In,Ga)Se2 14x concentration Efficiency (%) UNSW Stanford Spire UNSW ARCO Georgia Tech 20 NREL Sharp Georgia Tech Westing- house NREL Varian NREL NREL NREL 16 UniversitySo. Florida NREL No. Carolina StateUniversity NREL AstroPower Euro-CIS Boeing Solarex ARCO 12 Kodak Boeing Boeing United Solar AMETEK University ofLausanne Masushita United Solar Kodak Boeing AstroPower 8 Monosolar Photon Energy Siemens RCA Princeton Solarex Boeing University Linz University ofLausanne University of Maine 4 RCA RCA ECN, The Netherlands RCA RCA Cambridge RCA RCA Kodak UCSB UC Berkeley 0 1975 1980 1985 1990 1995 2000 2005 026587136
In Process Solar Facilities Topaz/Optipower 550 MW farm using thin film panels on 9.5 sq mi. or 58 MW/sq. mi. delivers 0.1 x 10^6 MWh/yr./sq. mi.* SunPower 250 MW high (18%) efficiency crystalline cell farm delivers 71.4 MW/sq mi. or 0.55 x 10^6 MWh on 3.5 sq. mi. w/ Suntrackers or 0.16 x 10^6 MWh/yr/sq.mi.* Solana Solar Thermal 284 MW on 1900 acres or 3 sq. mi. 284/3 = 95 MW/sq.mi. or about 0.2 x 10^6 MWh/yr/sq.mi. *These figures suggest that SunPower expects sun tracking to yield about 8 hrs. of output vs. 6 hrs for Topaz over about 285 days per year.