Download
1 / 1
10 likes | 334 Views
Visualization of Wireless Computer Networks. University of Kansas Geography Department. Dunbar, Matt D., Kansas Applied Remote Sensing Program and University of Kansas Geography Department, and Becker, Brett, Information and Telecommunication Technology Center, University of Kansas.

E N D
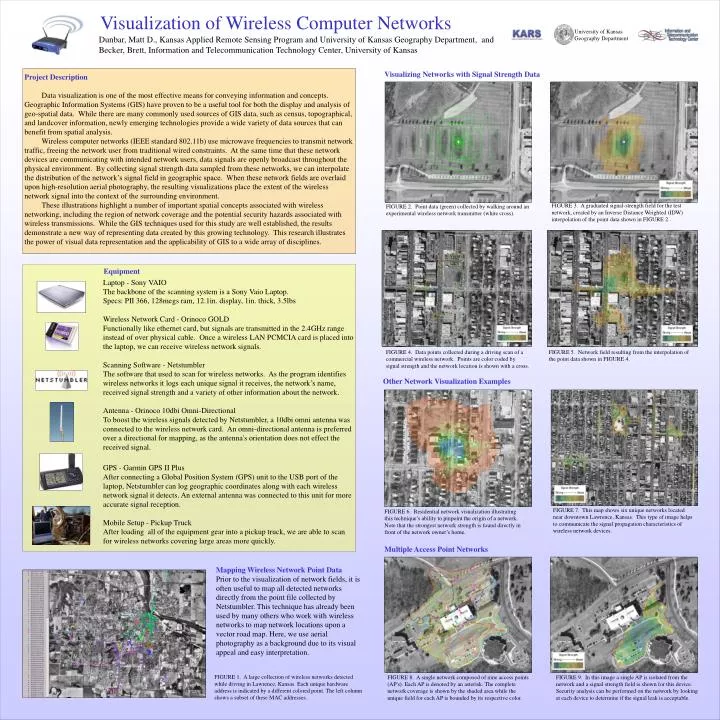
Visualization of Wireless Computer Networks University of Kansas Geography Department Dunbar, Matt D., Kansas Applied Remote Sensing Program and University of Kansas Geography Department, and Becker, Brett, Information and Telecommunication Technology Center, University of Kansas Project Description Data visualization is one of the most effective means for conveying information and concepts. Geographic Information Systems (GIS) have proven to be a useful tool for both the display and analysis of geo-spatial data. While there are many commonly used sources of GIS data, such as census, topographical, and landcover information, newly emerging technologies provide a wide variety of data sources that can benefit from spatial analysis. Wireless computer networks (IEEE standard 802.11b) use microwave frequencies to transmit network traffic, freeing the network user from traditional wired constraints. At the same time that these network devices are communicating with intended network users, data signals are openly broadcast throughout the physical environment. By collecting signal strength data sampled from these networks, we can interpolate the distribution of the network’s signal field in geographic space. When these network fields are overlaid upon high-resolution aerial photography, the resulting visualizations place the extent of the wireless network signal into the context of the surrounding environment. These illustrations highlight a number of important spatial concepts associated with wireless networking, including the region of network coverage and the potential security hazards associated with wireless transmissions. While the GIS techniques used for this study are well established, the results demonstrate a new way of representing data created by this growing technology. This research illustrates the power of visual data representation and the applicability of GIS to a wide array of disciplines. Visualizing Networks with Signal Strength Data FIGURE 3. A graduated signal-strength field for the test network, created by an Inverse Distance Weighted (IDW) interpolation of the point data shown in FIGURE 2.. FIGURE 2. Point data (green) collected by walking around an experimental wireless network transmitter (white cross). Equipment Laptop - Sony VAIO The backbone of the scanning system is a Sony Vaio Laptop. Specs: PII 366, 128megs ram, 12.1in. display, 1in. thick, 3.5lbsWireless Network Card - Orinoco GOLDFunctionally like ethernet card, but signals are transmitted in the 2.4GHz range instead of over physical cable. Once a wireless LAN PCMCIA card is placed into the laptop, we can receive wireless network signals.Scanning Software - NetstumblerThe software that used to scan for wireless networks. As the program identifies wireless networks it logs each unique signal it receives, the network’s name, received signal strength and a variety of other information about the network. Antenna - Orinoco 10dbi Omni-DirectionalTo boost the wireless signals detected by Netstumbler, a 10dbi omni antenna was connected to the wireless network card. An omni-directional antenna is preferred over a directional for mapping, as the antenna's orientation does not effect the received signal. GPS - Garmin GPS II PlusAfter connecting a Global Position System (GPS) unit to the USB port of the laptop, Netstumbler can log geographic coordinates along with each wireless network signal it detects. An external antenna was connected to this unit for more accurate signal reception.Mobile Setup - Pickup Truck After loading all of the equipment gear into a pickup truck, we are able to scan for wireless networks covering large areas more quickly. + + FIGURE 4. Data points collected during a driving scan of a commercial wireless network. Points are color coded by signal strength and the network location is shown with a cross. FIGURE 5. Network field resulting from the interpolation of the point data shown in FIGURE 4. Other Network Visualization Examples FIGURE 7. This map shows six unique networks located near downtown Lawrence, Kansas. This type of image helps to communicate the signal propagation characteristics of wireless network devices. FIGURE 6. Residential network visualization illustrating this technique’s ability to pinpoint the origin of a network. Note that the strongest network strength is found directly in front of the network owner’s home. Multiple Access Point Networks Mapping Wireless Network Point DataPrior to the visualization of network fields, it is often useful to map all detected networks directly from the point file collected by Netstumbler. This technique has already been used by many others who work with wireless networks to map network locations upon a vector road map. Here, we use aerial photography as a background due to its visual appeal and easy interpretation. FIGURE 1. A large collection of wireless networks detected while driving in Lawrence, Kansas. Each unique hardware address is indicated by a different colored point. The left column shows a subset of these MAC addresses. FIGURE 8. A single network composed of nine access points (AP's). Each AP is denoted by an asterisk. The complete network coverage is shown by the shaded area while the unique field for each AP is bounded by its respective color. FIGURE 9. In this image a single AP is isolated from the network and a signal strength field is shown for this device. Security analysis can be performed on the network by looking at each device to determine if the signal leak is acceptable.