Download
1 / 1
10 likes | 565 Views
Comparisons of Nutrient Levels. Appleton East High School. Hypothesis. Results. Bar and Whisker Representations. We began with a few basic research questions:

E N D
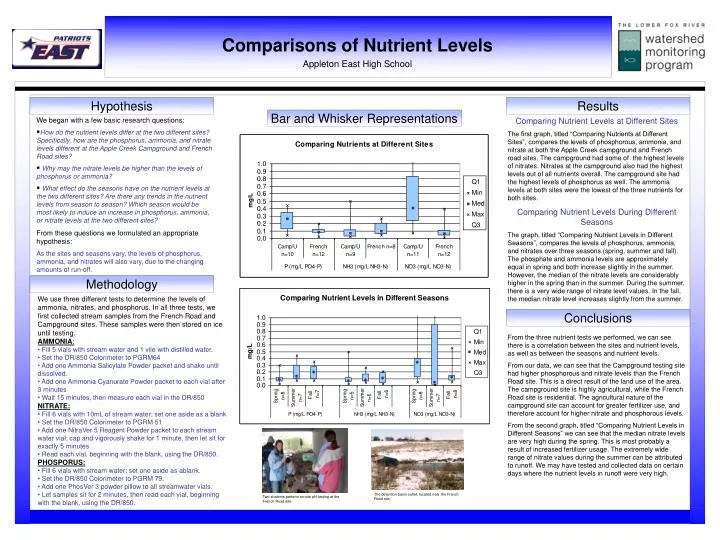
Comparisons of Nutrient Levels Appleton East High School Hypothesis Results Bar and Whisker Representations • We began with a few basic research questions: • How do the nutrient levels differ at the two different sites? Specifically, how are the phosphorus, ammonia, and nitrate levels different at the Apple Creek Campground and French Road sites? • Why may the nitrate levels be higher than the levels of phosphorus or ammonia? • What effect do the seasons have on the nutrient levels at the two different sites? Are there any trends in the nutrient levels from season to season? Which season would be most likely to induce an increase in phosphorus, ammonia, or nitrate levels at the two different sites? From these questions we formulated an appropriate hypothesis: As the sites and seasons vary, the levels of phosphorus, ammonia, and nitrates will also vary, due to the changing amounts of run-off. Comparing Nutrient Levels at Different Sites The first graph, titled “Comparing Nutrients at Different Sites”, compares the levels of phosphorous, ammonia, and nitrate at both the Apple Creek campground and French road sites. The campground had some of the highest levels of nitrates. Nitrates at the campground also had the highest levels out of all nutrients overall. The campground site had the highest levels of phosphorus as well. The ammonia levels at both sites were the lowest of the three nutrients for both sites. Comparing Nutrient Levels During Different Seasons The graph, titled “Comparing Nutrient Levels in Different Seasons”, compares the levels of phosphorus, ammonia, and nitrates over three seasons (spring, summer and fall). The phosphate and ammonia levels are approximately equal in spring and both increase slightly in the summer. However, the median of the nitrate levels are considerably higher in the spring than in the summer. During the summer, there is a very wide range of nitrate level values. In the fall, the median nitrate level increases slightly from the summer. Methodology • We use three different tests to determine the levels of ammonia, nitrates, and phosphorus. In all three tests, we first collected stream samples from the French Road and Campground sites. These samples were then stored on ice until testing. • AMMONIA: • Fill 5 vials with stream water and 1 vile with distilled water. • Set the DR/850 Colorimeter to PGRM64 • Add one Ammonia Salicylate Powder packet and shake until dissolved. • Add one Ammonia Cyanurate Powder packet to each vial after 3 minutes • Wait 15 minutes, then measure each vial in the DR/850 • NITRATE: • Fill 6 vials with 10mL of stream water; set one aside as a blank • Set the DR/850 Colorimeter to PGRM 51 • Add one NitraVer 5 Reagent Powder packet to each stream water vial; cap and vigorously shake for 1 minute, then let sit for exactly 5 minutes. • Read each vial, beginning with the blank, using the DR/850. • PHOSPORUS: • Fill 6 vials with stream water; set one aside as ablank. • Set the DR/850 Colorimeter to PGRM 79. • Add one PhosVer 3 powder pillow to all streamwater vials. • Let samples sit for 2 minutes, then read each vial, beginning with the blank, using the DR/850. Conclusions From the three nutrient tests we performed, we can see there is a correlation between the sites and nutrient levels, as well as between the seasons and nutrient levels. From our data, we can see that the Campground testing site had higher phosphorous and nitrate levels than the French Road site. This is a direct result of the land use of the area. The campground site is highly agricultural, while the French Road site is residential. The agricultural nature of the campground site can account for greater fertilizer use, and therefore account for higher nitrate and phosphorous levels. From the second graph, titled “Comparing Nutrient Levels in Different Seasons” we can see that the median nitrate levels are very high during the spring. This is most probably a result of increased fertilizer usage. The extremely wide range of nitrate values during the summer can be attributed to runoff. We may have tested and collected data on certain days where the nutrient levels in runoff were very high. The detention basin outlet, located near the French Road site. Two students perform on-site pH testing at the French Road site.