Download
1 / 30
340 likes | 607 Views
Cortical Functions and Their Measurement: Vision as a Prototype. Autoradiography 2-deoxyglucose (2-DG). fMRI. Six Layers of Cortex. LGN input Parvo Magno. Classic Cytoarchitectonic Map of Brodmann (1909). Classic name for visual cortex : Areas 17, 18, 19.

E N D
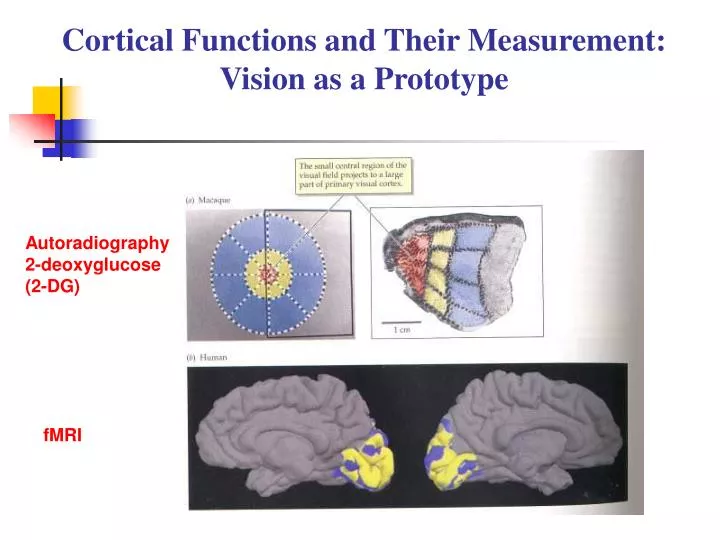
Cortical Functions and Their Measurement: Vision as a Prototype Autoradiography 2-deoxyglucose (2-DG) fMRI
Six Layers of Cortex LGN input Parvo Magno
Classic Cytoarchitectonic Map of Brodmann (1909) Classic name for visual cortex : Areas 17, 18, 19
Visual Field and the Human Visual System The visual field represented in its projection to the retina demonstrates how the lens of the eye inverts the image being viewed. Up is inverted down and right is represented on the left. Signals from the right retinas (left visual field) of both eyes travel through the optic nerve, optic tract, and optic radiations to the primary visual cortex in the right hemisphere. Signals from the left retinas (right visual field) travel to the left hemisphere. Primary visual cortex lies in the colored area along the calcarine sulcus. Colors show how the different sectors of the visual fields map on to primary visual cortex.
Receptive Fields of Lateral Geniculate and Primary Visual Cortex
Mapping Human Striate Cortex (V1) with Positron Emission Tomography (PET) • Checkerboards were used to present stimuli to different parts of the visual fields. The leftmost checkerboard is a foveal stimulus, the middle one presents a stimulus close to the fovea (parafoveal), and the rightmost one is a peripheral stimulus that surrounds the parafovea from 5.5 to 15°. • Stimuli could also be presented to the upper quadrant (e.g., rightmost stimulus) or the lower quadrant (e.g., middle stimulus). (Courtesy of Posner and Raichle).
PET Techniques for Studies of the Human Visual System Upper row: Control PET scans (resting while looking at static fixation point is subtracted from looking at a flickering checkerboard stimulus positioned 5.5° from fixation point). Middle row: Subtraction produces a somewhat different image for each of 5 subjects. Bottom row: The 5 images are averaged to eliminate noise, producing the image at the bottom.
Checkerboard Stimuli and Calcarine Sulcus Activation The foveal stimulus presented in the center of the visual field activated calcarine cortex most posteriorly and at the midline, the middle parafoveal stimulus stimulated calcarine cortex more anteriorly at the midline, and the rightmost more peripheral stimulus produced the most anterior activations at the midline. Stimulation of the upper and lower halves of the visual field reliably produces areas of activation below (left) and above (right) the calcarine sulcus.
Unfolded Map of Cortex of the Monkey Brain Highlighting Extrastriate Visual Cortex Multiple Cortical Areas Devoted to Visual Functions David Van Essen developed the graphic technique of unfolding the cortex to better appreciate the many areas that contribute to vision. Colored areas are devoted to visual function and brownareas are devoted to other functions.
Extensive Interconnections Between Systems Identified in Primate Brain Separation and Integration of Function Areas of the monkey visual system (shown previously on unfolded cortex) are heavily interconnected.
Dorsal (“Where”) and Ventral (“What”) Visual Streams in Monkey Parietal (Dorsal) and Temporal (Ventral) Processing Streams Areas MT and V4 in the Macaque Brain
Dorsal (“Where”) and Ventral (“What”) Visual Streams in Human (PET) Dorsal (where) pathway shown in green and blueand Ventral (what) pathway shown in yellow and redserve different functions. (Courtesy of Leslie Ungerleider).
Retinal and Thalamic Precursors of the Dorsal and Ventral Visual Pathways Magnocellular (dorsal) and parvocellular (ventral) pathways from the retina to the higher levels of the visual cortex are separate at the lower levels of the visual system. At higher levels they show increasing overlap.
Retinal Ganglion Cell Inputs to the Different Lateral Geniculate Nucleus (LGN) Layers LGN – showing six cellular layers. Magnocellular (green) and Parvocellular (brown). Koniocellular (pink)layers are tiny neurons ventral to each layer. The retina gives rise to streams of information that are processed in parallel.
The Lateral Geniculate Nucleus of the Macaque Monkey Tissues have been stained with Nissl to show cell bodies, which appear as dots. Note the six layers and the larger size of the cells in the two ventral layers. They are in the magnocellular layers, whereas the smaller cells are in the four dorsal parvocellular layers. (Adapted from Hubel, 1988).
PET Identification of Inferior Occipital Region Activated by Color Activation produced by staring at colored stimuli. Panel A shows the blood flow images before subtraction. Panel B show activation after subtracting responses to the gray stimuli. Panel C depicts statistical significance of the responses. White is highest significance. Panel D shows the location of the most significant responses in a sagittal, coronal, and axial view (Courtesy of Frackowiak and Zeki). Multicolor abstract display (top) and version of the same display in shades of gray (bottom) used as stimuli
PET Identification in Humans of Cortical Region MT for Motion Perception A single slice shows the location of MT found by Frackowiak and Zeki in London (red squares) and Miezen, Petersen, and Fox in St. Louis (green circles). The areas of activation in the extrastriate cortex almost superimpose.
PET Activations of Word vs. Nonword Stimuli Brain shows much greater activation as subjects look at visual words (2nd row) than when they view a static fixation point (top row). Four different features of words
PET Activations of Word vs. Nonword Stimuli R L Blood flow responses in visual cortices to 4 types of stimuli. Note the prominent responses on the right to pseudowords and words as compared to letter strings and false fonts.
Procedure for Visual Attention Experiment Color vs. Form vs. Motion Subjects were given one of 5 different instructions representing the 5 conditions. 1. Passive control. “Observe the display.” 2. Divided attention. “Press a key if any of the elements change.” 3. Focal attention. “Press a key if only color changes.” 4. Focal attention. “Press a key only if form changes.” 5. Focal attention. “Press a key if only motion changes.”
Visual Attention:Color, Form, and Movement Activation remaining after divided condition subtracted from each of 3 focal attention conditions. Red boxes = color activation. Yellow boxes = motion activation. (Courtesy of Posner and Raichle).
Retinohypothalamic Pathway: Visual Input Maintains Circadian Rhythms Pathway from retina to the suprachiasmic nucleus (SCN) carries information about the light-dark cycle in the environment to the SCN. The size of the SCN is enlarged for viewing. Axons from the left eye are labeled in red and from the right eye in green. Both eyes project so diffusely to the two overlying SCN that they are outlined in yellow. (SCN photograph courtesy of Cynthia L. Jordan).
Electroencephalography and Stages of Arousal and Consciousness Donald B. Lindsley 1907-2003