Download
1 / 29
290 likes | 479 Views
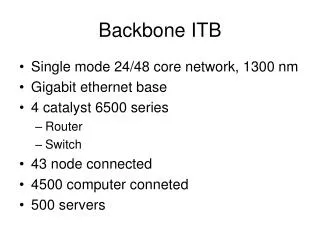
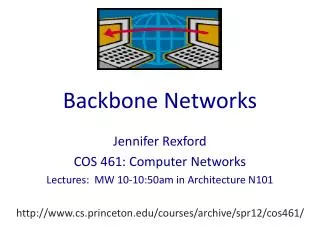
Backbone Performance Comparison. Jeff Boote, Internet2 Warren Matthews, Georgia Tech John Moore, MCNC. Overview. We (in NC) were asked to compare the relative performance of various IP service providers Interest from both local CIOs and Internet2

E N D
Backbone Performance Comparison Jeff Boote, Internet2 Warren Matthews, Georgia Tech John Moore, MCNC
Overview • We (in NC) were asked to compare the relative performance of various IP service providers • Interest from both local CIOs and Internet2 • We decided to measure relative end-to-end latency and jitter • Recruited a few other ITECs (Ohio and Texas) and GA Tech to help • Jeff Boote got interested since we were using owamp
Method • Setup owamp machine at each site with multiple interfaces per NIC • Use host routes to force traffic to a specific destination via a specific provider • Create a mesh of these running continuously and dump results to a database • Add traceroute information to verify paths and look for routing changes
Path types • Path will vary depending on whether source and destination sites share provider, or not. • Doesn’t take “natural” or policy routing into consideration, but useful for comparative purposes.
As we progressed… • New paths became available… • VPLS (Layer 2 VLAN) between three of the ITECs (NC, OH and TX) • Described in sidebar • NLR PacketNet between NC and GT • Not all that interesting, since both sites attach to the same NLR router in Atlanta • Added NLR to new interface on same NIC, added VPLS to a separate NIC on the same machines • TAMU site setup and running, but o good data available yet • Had to remove host routes due to other routing changes going on locally
Available Data from OWAMP • Latency • Latency variation (jitter ~ 95%-min) • TTL (num hops) • Duplicates • Loss • Reordering (not likely at 1 pps)
OWAMP “sender” configuration • Each host has multiple virtual addresses configured (one per “network”) • Continuous stream of packets (1 pps - exp dist.) per network address “pair” • Traffic is directed onto specific network based on dest address Only last router before “backbone” shown
LATAB(Traceroute when source is routed through Abilene) OH nms4-ipls NYCM IPLS CHIN KSCY NC WASH nms4-hstn HSTN ATLA nms4-wash TAMU GT
LATQW (Traceroute when source is routed through Qwest) CHI-EDGE NC CHI-CORE DCA-CORE DCA-EDGE ATLA-CORE ATLA-EDGE OH GT
LATL3 (Traceroute when source is routed through Level3) Qwest Washington Asymmetric routing: Northbound via Charlotte Southbound via Raleigh. Washington Washington Raleigh NC Unknown Charlotte Charlotte Atlanta OH Unknown Unknown GT ATLAL3
LATO3 (Traceroute when source is routed through another provider - GT/Cogent) OH NC Qwest CORE ATLA GT
LATNLR NC ATLA GT
LATVPLS OH NC TAMU
Preliminary Results • Small amount of data collected so far • Working on how best to visualize combination of pieces (latency, loss, routing changes, etc.) • Looking for “stability” metric (but stability is application dependent) • More analysis needed
NLR is lower latency. This is expected as GT and NC are connected to the same router. NC connection is backhauled via NLR L2 service. Qwest and Abilene go via Washington. The long way… For the Level3 path, there is an unidentified hop just before the GT campus. Rate limiter? Expected NLR and Level3 paths to be closer NC to GT Qwest NLR Level3 Abilene
GT to NC • NLR and Level3 paths similar • Cogent hands off to Qwest to get to NC Qwest NLR Cogent Level3 Abilene
Latency RangeNC to GT Level3 via Raleigh Level3 via Charlotte Input to GT is always longer?
NC to OH • Marginally quicker across Qwest (via Washington and Chicago). • Abilene via New York, Chicago and Indianapolis. Qwest Level3 Abilene
OH to NC • OH doesn’t use Level3, so no return path to NC via Level3 Abilene Qwest
Latency RangeNC to OH No return path for L3_NC_OH
GT to OH • Abilene more direct via Indianapolis • Qwest via Chicago • Cogent, Level3 hand off to Qwest Cogent Abilene Qwest Level3
OH to GT • OH doesn’t use Level3, so no return path to GT via Level3 Qwest Abilene
Latency RangeGT to OH No return path for L3_GT_OH.
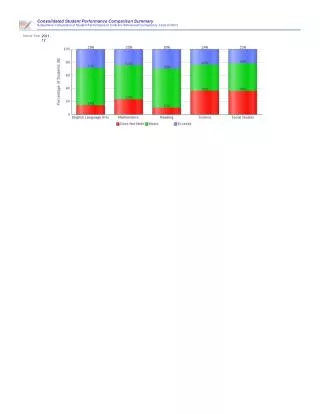
Summary • From a latency perspective, topology is the overriding parameter • So far we’re not seeing huge latency deltas between R&E and commodity between two endpoints • Loss in commodity networks is pretty good • They’ve improved in the last 10 years • Looking for a quality metric (stability?) to combine the things we can measure
VPLS Sidebar • Virtual Private LAN Service - multipoint Ethernet service over IP/MPLS backbone • Created between ITECs as overlay on Abilene • PE routers sit in GigaPoP address space, interconnected via interdomain LSPs • Abilene T640s are P routers
VPLS Overview • Full Mesh of LSPs • BGP for inter-PE communication • Ethernet encapsulation at PE-CE
View from Ohio To NC To TX No routers!
View from NC PE Local NC MAC address OH MAC address TX MAC address