Download
1 / 43
520 likes | 1.25k Views
GIS Applications in Meteorology and Hydrology. John S. Quinlan NWS Albany, NY. What is GIS? Geographic Information Systems. Systems of hardware and software which store, retrieve, map and analyze geographic data in relational databases.

E N D
GIS Applications in Meteorology and Hydrology John S. Quinlan NWS Albany, NY
What is GIS?Geographic Information Systems • Systems of hardware and software which store, retrieve, map and analyze geographic data in relational databases. • GIS uses spatial and attribute data with vector and raster data structures, and topology to create geographic data models. • GIS also allows for the representation of a third dimension which is usually elevation (i.e. Digital Elevation Model (DEM) produced by the USGS).
A view is an interactive map that allows you to display, query and analyze data. ArcView supports tabular data in dBASE, delimited text and INFO format. Charts are linked to maps and tables and allow for the display of additional info. Layouts let you assemble all the components you want to appear in a map. Scripts are project components that can be associated with either a control, such as a menu item or a button, or with an event.
DEM is a file format created by the USGS for storing elevation data. Converting DEM elevation data to grid format allows the user to determine slope, aspect, hillshade and contour.
Elevations and Towns at 500 FT Increments in ALY Forecast Area
What is Spatial Analyst • It is a GIS extension which allows the user to study the locations and shapes of geographic features and the relationships between them. • It is very useful for analyzing meteorological or hydrologic data in terms of geographic distribution, and for verification analyses of forecasts and warnings.
Spatial Analyst Surface Interpolators(These Create a Continuous Surface from Sampled Input Points) • Inverse Distance Weighted (IDW) - assumes each input point has an influence which diminishes with distance. • Spline - is an interpolation method that fits a minimum-curvature surface through the input points. • Kriging - is a specialized interpolation method that assumes the spatial distance or direction between points shows spatial correlation. • Trend - is an interpolator that fits a mathematical function to all input ponts.
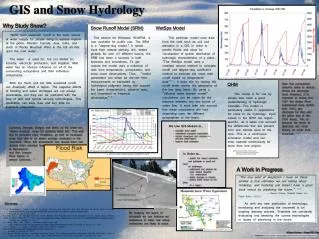
Even with the correct QPF, your snow forecast can be off target.
Notice the Snow to Liquid Ratio varied from 10-20:1 to 40-50:1
Snowfall Verification 12/9/05(Forecast vs. Observed from GIS)
April 2-4, 2005 Flood Event Use of GIS to Improve Flood Warnings
Antecedent Conditions http://www.wrcc.dri.edu/spi/spi.html
Major East Coast Storm with Tremendous Upslope Flow into the Catskills April 2-3, 2005
Precipitation and SnowmeltApril 2-4, 2005 • GIS Basin Average Rainfall 4.01” in the Esopus Basin and 4.28” in the Rondout Basin. • GIS Basin Average Water Content released from Snow 3.76” in the Esopus Basin and 3.00” in the Rondout Basin. • Little if any use of water by vegetation.
April 2-4, 2005 Flood Event • Combination of Heavy Rain and Snowmelt • 35 Million in Federal Disaster Assistance • Gage/Flood Stage/Crest/Date/Rank MTRN6 FS = 11.0, 20.58 4/3/05 (3rd) MRNN6 FS = 20.0, 26.46 4/4/05 (1st) ROSN6 FS = 18.0, 24.96 4/3/05 (2ND)
High Wind Event 2/17/06 • National Grid reported that 120,000 out of their 520,000 customers across eastern New York were without power. 328,000 customers were without power across the state. • Wind Gusts of 60 to 80 MPH were common. • Hundreds of power poles were snapped. • Largest amount of wind damage since remnants of Floyd in 1999 and the Labor Day Derecho in 1998.
Summary and Future Work • GIS has many applications in Meteorology and Hydrology. It can help with the analysis of data as well as the issuance of warnings and verification. • Future work includes automating the analysis of the snow survey data and creation of snow grids from past storms which can be imported into GFE for storms with similar characteristics.