Download
1 / 16
160 likes | 423 Views
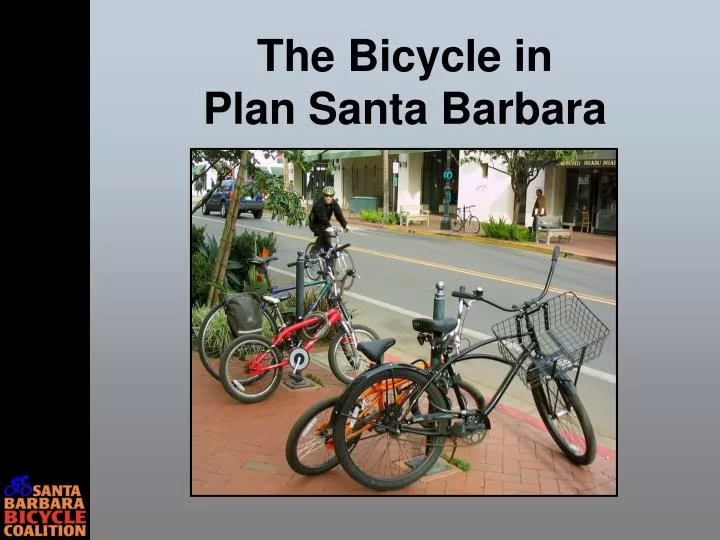
The Bicycle in Plan Santa Barbara. Why the Bicycle?. It’s the most energy-efficient mode of transportation It weighs 1/6 of its payload It runs on 1/10 horsepower It occupies 1/12 the space of a car It does not pollute It’s quiet It provides healthy, non-impact exercise.

E N D
Why the Bicycle? • It’s the most energy-efficient mode of transportation • It weighs 1/6 of its payload • It runs on 1/10 horsepower • It occupies 1/12 the space of a car • It does not pollute • It’s quiet • It provides healthy, non-impact exercise
Make Bicycling aCommunity Indicator • We know that 3.4% Santa Barbara residents bike to work • However, only 15-20% of all trips are those to work • We don’t know most trip lengths, durations, modes or destinations • So we really don’t know what’s happening now, or what’s changing
Promote Bicycling • Cars are advertised everywhere • MTD uses government funds to advertise on their buses, in print, and online • The most sustainable mode, bicycling, is on its own
1990-2000 Census shows bicycle commute increase • Santa Barbara and US increased • SB County and California decreased
Bicycling in Santa Barbara continues to increase • A 12-hour survey of 6 intersections in June 2008 showed a 14% bicyclist increase over the 2000-2007 counts.
Santa Barbara residents want more bike lanes • Our Earth Day 2008 poll asked what would encourage more people to bicycle
What can we learn from others? • Odense, Denmark • Lyon, France • Davis, California • The Netherlands • Australia • Marin County, California
Odense, Denmark • In 1999-2002, the DanishDepartment of Transportspent $3.7 million on Odense • 50 projects of bikeway improvements, changed regulations, campaigns • Bicycling is up 20%, driving down 15% • Now 25% of all trips are by bicycle • Odense has saved $6.1 million health care costs
Lyon, France • Lyon, France started abicycle sharing program in2005 with 4000 bicycles • Bicycling has increased 30% • Driving has decreased 4%, saving 3000 tons of CO2 in 2 years • 55% of those sharing bicycles are driving less than before
Davis, California • 15% of work commute tripsare by bicycle • In 1966, the city copied European bike lanes and paths • Davis (pop 65,000) has 50 miles bike lanes, 50 miles bike paths • Their General Plan promotes infill, multi-family housing throughout the city, and neighborhood services
The Netherlands • 27% of all trips are bybicycle • Since 1980, bicycling has increased 45% while fatalities dropped to a third • They provide good bike facilities, traffic calming, educational programs, law enforcement, and restrictions on automobile use
Australia • Starting in 2000, cities allover Australia have started “individualized marketing”of transportation • Households, schools and businesses are offered solutions for their needs • Households have decreased car use by 4-15%, increased alternative use • Success resulted from personal engagement, local leader support, material on travel options
Marin County,California • A federal grant targeted the21% morning congestion ofparents driving children • 73% students were driven by car • Nine pilot schools received safety improvements, promotion and events • The result is 57% increase in students biking and walking, and a 29% decrease in being driven
Thank you. www.sbbike.org