Download
1 / 6
60 likes | 494 Views
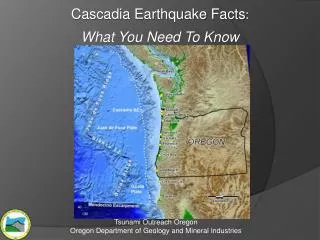
Cascadia Group Datasheet for finding GPS location and velocity data from the EarthScope Plate Boundary Observatory website for sites NEAH, P401, and P403 Name: ____________________________________________________________

E N D
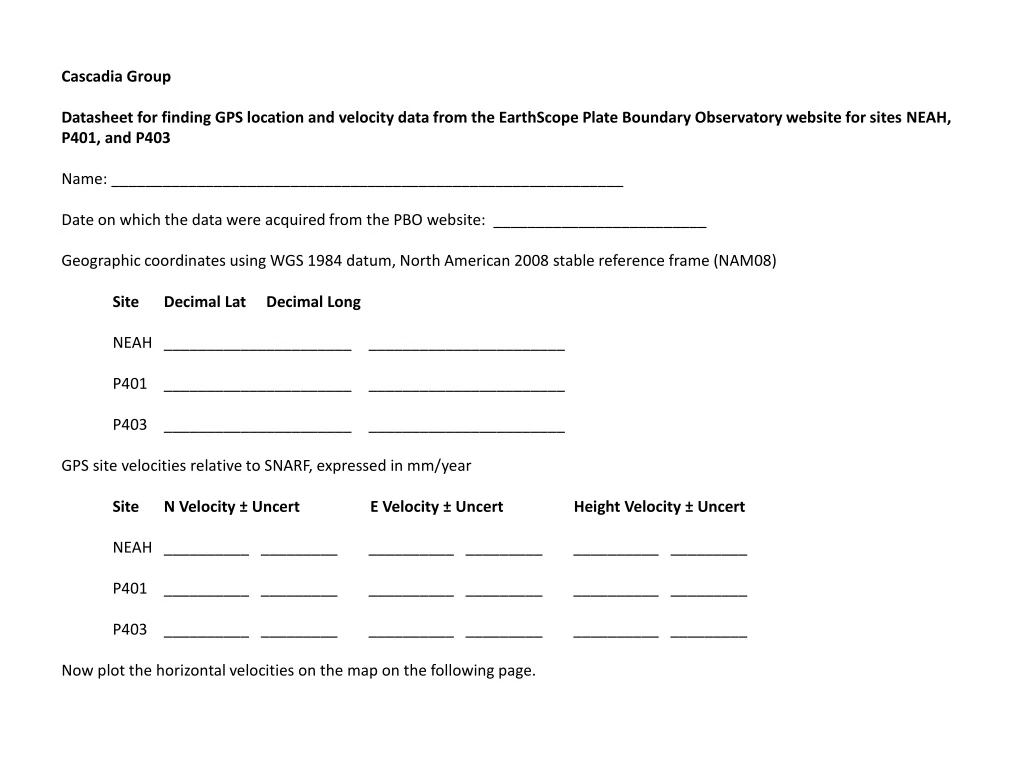
Cascadia Group Datasheet for finding GPS location and velocity data from the EarthScope Plate Boundary Observatory website for sites NEAH, P401, and P403 Name: ____________________________________________________________ Date on which the data were acquired from the PBO website: _________________________ Geographic coordinates using WGS 1984 datum, North American 2008 stable reference frame (NAM08) Site Decimal Lat Decimal Long NEAH ______________________ _______________________ P401 ______________________ _______________________ P403 ______________________ _______________________ GPS site velocities relative to SNARF, expressed in mm/year Site N Velocity ± Uncert E Velocity ± Uncert Height Velocity ± Uncert NEAH __________ _________ __________ _________ __________ _________ P401 __________ _________ __________ _________ __________ _________ P403 __________ _________ __________ _________ __________ _________ Now plot the horizontal velocities on the map on the following page.
Cascadia Group. Carefully draw the E–W and N–S velocity vectors associated with the three PBO GPS sites shown as green dots in the map below. A negative east component is a vector pointing west, and a negative north component is a vector pointing south. The graphs are scaled in units of millimeters per year. Then draw the total horizontal velocity vector for each site, and determine the horizontal speed (that is, the length of the total horizontal velocity vector) of each site. You can determine the total horizontal speed by one of the methods shown at right below. NEAH P403 P401 Total horizontal speeds: NEAH _______________mm/yr; P401 _______________mm/yr; P403 _______________mm/yr
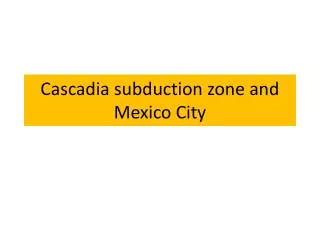
Wasatch Group Datasheet for finding GPS location and velocity data from the EarthScope Plate Boundary Observatory website for sites P088, P116, and COON Name: ____________________________________________________________ Date on which the data were acquired from the PBO website: _________________________ Geographic coordinates using WGS 1984 datum, North American 2008 stable reference frame (NAM08) Site Decimal Lat Decimal Long P088 ______________________ _______________________ P116 ______________________ _______________________ COON ______________________ _______________________ GPS site velocities relative to SNARF, expressed in mm/year Site N Velocity ± Uncert E Velocity ± Uncert Height Velocity ± Uncert P088 __________ _________ __________ _________ __________ _________ P116 __________ _________ __________ _________ __________ _________ COON __________ _________ __________ _________ __________ _________ Now plot the horizontal velocities on the map on the following page.
Wasatch Group. Carefully draw the E–W and N–S velocity vectors associated with the three PBO GPS sites shown as green dots in the map below. A negative east component is a vector pointing west, and a negative north component is a vector pointing south. The graphs are scaled in units of millimeters per year. Then draw the total horizontal velocity vector for each site, and determine the horizontal speed (that is, the length of the total horizontal velocity vector) of each site. You can determine the total horizontal speed by one of the methods shown at right below. P088 COON P116 Total horizontal speeds: P088 _______________mm/yr; P116 _______________mm/yr; COON _______________mm/yr
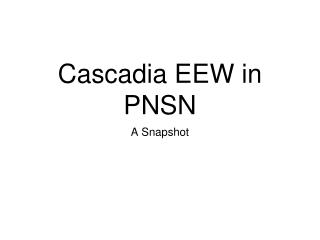
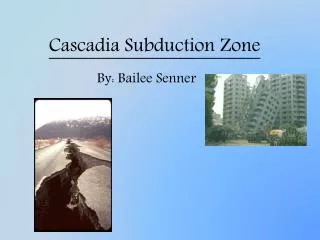
San Andreas Group Datasheet for finding GPS location and velocity data from the EarthScope Plate Boundary Observatory website for sites P538, P539, and P541 Name: ____________________________________________________________ Date on which the data were acquired from the PBO website: _________________________ Geographic coordinates using WGS 1984 datum, North American 2008 stable reference frame (NAM08) Site Decimal Lat Decimal Long P538 ______________________ _______________________ P539 ______________________ _______________________ P541 ______________________ _______________________ GPS site velocities relative to SNARF, expressed in mm/year Site N Velocity ± Uncert E Velocity ± Uncert Height Velocity ± Uncert P538 __________ _________ __________ _________ __________ _________ P539 __________ _________ __________ _________ __________ _________ P541 __________ _________ __________ _________ __________ _________ Now plot the horizontal velocities on the map on the following page.
San Andreas group. Carefully draw the E–W and N–S velocity vectors associated with the three PBO GPS sites shown as green dots in the map below. A negative east component is a vector pointing west, and a negative north component is a vector pointing south. The graphs are scaled in units of millimeters per year. Then draw the total horizontal velocity vector for each site, and determine the horizontal speed (that is, the length of the total horizontal velocity vector) of each site. You can determine the total horizontal speed by one of the methods shown at right below. P539 P541 P538 Total horizontal speeds: P538 _______________mm/yr; P539 _______________mm/yr; P541 _______________mm/yr