Download
1 / 68
680 likes | 885 Views
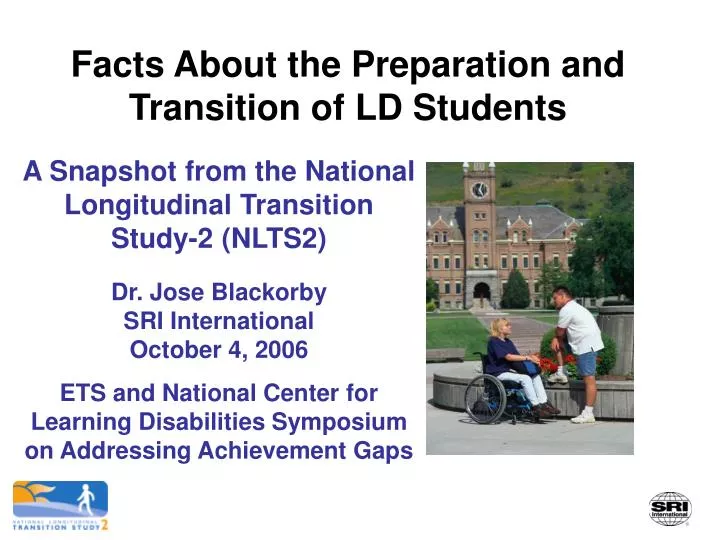
Facts About the Preparation and Transition of LD Students. A Snapshot from the National Longitudinal Transition Study-2 (NLTS2) Dr. Jose Blackorby SRI International October 4, 2006 ETS and National Center for Learning Disabilities Symposium on Addressing Achievement Gaps . Background.

E N D
Facts About the Preparation and Transition of LD Students A Snapshot from the National Longitudinal Transition Study-2 (NLTS2) Dr. Jose Blackorby SRI International October 4, 2006 ETS and National Center for Learning Disabilities Symposium on Addressing Achievement Gaps
Background • NLTS2 is a reprise of the original National Longitudinal Transition Study • Congressionally mandated, 1983; conducted by SRI,1984-1993. • Comprehensive information on secondary school-age students nationally as they transitioned to early adulthood. • Comparison of NLTS and NLTS2 important to the analysis agenda; facilitating valid comparisons has influenced the NLTS2 design.
Primary Research Questions • What are the characteristics of studentsreceiving special education in high school? • What educational programs and servicesdo they receive as they age? • What are their achievements in high school and early adulthood in terms of education, employment, social adjustment, and independent living? • What services and experiences contribute to better results? • How do programs, experiences, achievements, and other factors differ for youth with different characteristics? • How have programs, experiences and achievements changed since the late 1980s for young people with disabilities?
NLTS2 Generalizes to: • Students receiving special education who were 13 to 16 when the study began in 2001, as they transition into young adulthood. • Each of the 12 special education disability categories. • Each single-year age cohort.
NLTS2 Sample • 501 LEAs and 38 special schools representing variation in • Geographic region. • District size (student enrollment). • District wealth (student poverty). • 11,272 eligible students • Randomly selected by disability category. • Sampling rates higher for 16-year-olds to increase the number of youth who will be out of school the longest at the end of the study.
Data Collection Components • Parents • Telephone interviews (CATI). • Only respondent, wave 1. • First respondent (preceding youth interview), subsequent waves. • Simultaneous respondent, last three waves. • Youth • Telephone interviews (CATI) if able to answer by phone (2nd to5th waves). • Mail surveys (multiple components tailored to youth’s status) if able to answer, but not by phone (2nd to 5th waves). • Direct assessment/In-person interview • Assessment of reading, math, social studies, and science. • Interview of self-concept and self-determination.
Data Collection Components (continued) • Mail surveys of: • One of each student’s general education teachers about access to general education curriculum and student performance in that classroom context. • School staff best able to describe each student’s overall school program (often special education personnel) to describe program (e.g., placements), vocational education, special education, transition planning, and performance (e.g., days absent). • School principals regarding school characteristics and policies and aggregate measures of school performance. • High school transcripts of courses taken and grades.
Data Sources Wave 1 (2001-02) Parent interview (n=9,230) Student’s School Program Survey(n=6,038), completed by the school staff member most knowledgeable about the student’s overall program. Teacher Survey (n=2,822)completed by a general education academic teacher. Publicly available school data. Wave 2 (2003) Parent/Youth interview (n=4,270) 9
Today’s Agenda During school: • Transition planning • School Programs • Academic performance • School completion In the early years after school: • Postsecondary education • Employment • Social engagement and adjustment
Parents’ Expectations for Youth with Learning Disabilities Youth will: <1 Source: NLTS2 Wave 1 Parent Interview.
Transition Planning Experiences - Themes - Initiation of transition planning - Participants - Decision making - Goals - Supports - Post-school services identified - Contacts made 13
Transition Planning Themes • Mixed results in best practices being met for all students with disabilities and students with learning disabilities. • Process develops over time as students progress through school.
Student Has a Transition Plan, by Grade Level Source: NLTS2 with student school program survey.
Transition PlanningBest Practices • Begin transition planning by age 14 or earlier. • IEPs to include: • Transition-related content focusing on student’s course of study no later than age 14. • Statement of needed postschool transition services and interagency responsibilities, or linkages no later than age 16.
Age Transition Planning Started for Students with Transition Plans Mean age 14.4 years Source: NLTS2 Wave 1 Student’s School Program Survey.
Transition Planning for Youth withLearning Disabilities Transition planning being done Has received instruction intransition planning Has course of study likely toachieve transition goals Suitability of school program to achieving transition goals: Very well suited Fairly well suited Somewhat wellsuited Not at all well suited Source: NLTS2 Wave 1 Student’s School Program Survey.
Most Frequently Identified Post-High School Service Needs of Youth with Learning Disabilities Source: NLTS2 Wave 1 Student's School Program Survey, 2002.
Transition Planning Best Practices • Together with their parents, students with disabilities are expected to play a vital role. • Students’ preferences and interests must be considered. • Coordinated planning among special and general education personnel and community service agencies, as well as parents and students, best meet transition needs of youth.
Active Participants in Transition Planning* Outside agencies & others** *Involved in discussions about services and goals**SSA staff, employers, representatives of postsecondary schools, and advocates, etc. Source: NLTS2 Wave 1 Student’s School Program Survey.
Decision-Making at IEP Meetings Parents report goals are determined Source: NLTS2 Wave 1 Student’s School Program Survey.
Student’s Role in Transition Planning, by Grade Level Source: NLTS2 Wave 1 Student’s School Program Survey.
Transition Planning Best Practices • A variety of supports can be necessary for students to make progress towards their goals including: • A course of study specified in the transition plan • Instruction focused on transition planning skills • Identification of postschool service or program needs.
Transition Plan Specifies Course of Study to Achieve Transition Goals, by Grade Level Source: NLTS2 Wave 1 School Program Survey.
Student Receives Instruction in Transition Planning, by Grade Level Source: NLTS2 Wave 1 Student’s School Program Survey.
Postschool Services Identified in Students’ Transition Plans, by Grade Level (all other needs <4%: social work, mental health, and behavioral interventions) Source: NLTS2 Wave 1 Student’s School Program Survey.
Information about Postschool Services Provided to Parents, by Grade Level Source: NLTS2 Wave 1 Student’s School Program Survey.
Contacts Made by Schools Regarding Post-High School Programs or Services Source: NLTS2 Wave 1 Student’s School Program Survey.
Suitability of Students’ Programs to Achieve Transition Goals, by Grade Level * * * = none reported “Not at all suited.” Source: NLTS2 Wave 1 School Program Survey.
Parents’ Satisfaction with Transition Planning and Goals Goals are appropriate: Transition planning was: Source: NLTS2 Wave 1 Parent Interview.
Secondary School Academic Experiences - Academic course-taking and settings- General education classes- Taking college entrance exams 34
Academic Course-taking by Youth with Learning Disabilities Source: NLTS2 Wave 1 Student’s School Program Survey.
Instructional Setting by Type of Academic Class Source: NLTS2 Wave 1 Student’s School Program Survey.
Difference in Taking Academic Courses in General Education Setting: 1987 to 2001 Source: NLTS school record abstract and NLTS2 Wave 1 Student’s School Program Survey.
General Education Academic Class Level Source: NLTS2 Wave 1 Teacher Survey.
Extent of Curriculum Modification in General Education Academic Classes Source: NLTS2 Wave 1 Teacher Survey.
Accommodations and Modifications Provided to Students with LD in General Education Classes Source: NLTS2 Wave 1 General Education Teacher Survey.
Participation in Standardized Testing for Students with Learning Disabilities Source: NLTS2 Wave 1 Student’s School Program Survey.
Accommodations for Standardized Testing for Students with Learning Disabilities Source: NLTS2 Wave 1 Student’s School Program Survey.
Grades and Retention Among LD Students Source: NLTS2 Wave 1 Student’s School Program Survey.
Language Arts Skills of LD Students Mean percentile 20 31 Source: NLTS2 student assessments, 2002 and 2004.
Mathematics Performance of LD Students Mean percentile 28 28 Source: NLTS2 student assessments, 2002 and 2004.
Content Knowledge of LD Students Mean percentile 28 26 Source: NLTS2 student assessments, 2002 and 2004.
High School Completion NOTE: Includes only students who receive letter grades.Source: SEELS and NLTS2 Wave 1parent interviews, 2000 and 2001, respectively.
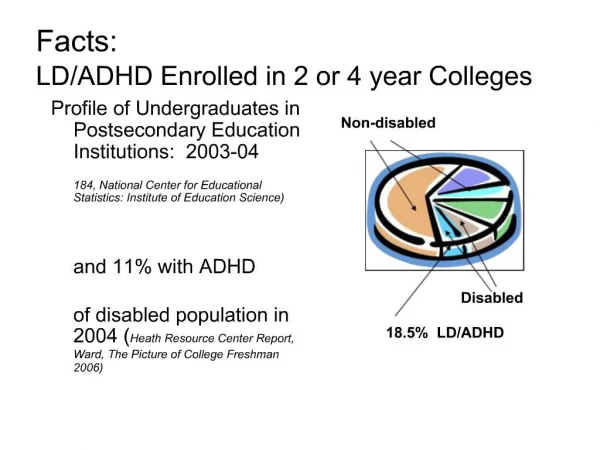
Postsecondary School Enrollment of Youth with Learning Disabilities Sources: NLTS2 Wave 2 Parent/Youth Interviews and for General Population, NLSY 2000 data for 5- through 19-year-olds. Note: Includes youth enrolled in any postsecondary classes since leaving high school.
Vocational Preparation and Work Experience - Vocational course-taking - Vocational services, job training and work experience - Work-related activities - Paid employment 52
Vocational Course-taking by Youth with Learning Disabilities Student takes: Settings for: Source: NLTS2 Wave 1 School Program Survey.