Download
1 / 32
360 likes | 579 Views
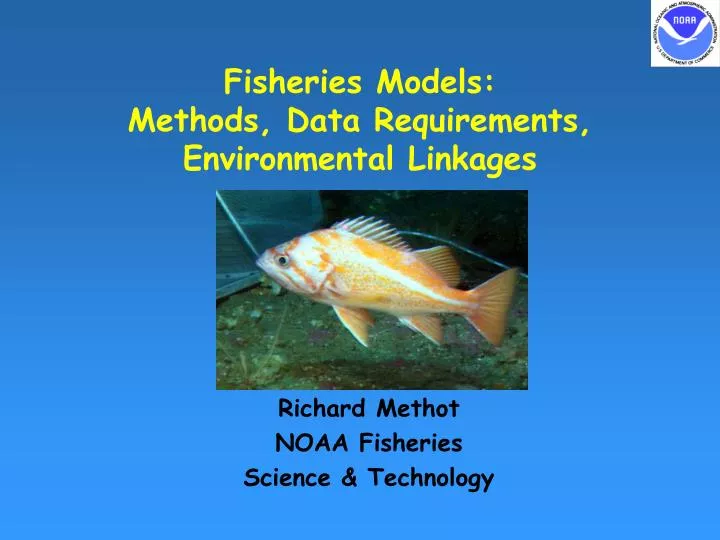
Fisheries Models: Methods, Data Requirements, Environmental Linkages. Richard Methot NOAA Fisheries Science & Technology. PRESENTATION OUTLINE. Assessment Goals What is a “Stock Assessment”? Data Inputs Assessment Methods Role of Environmental Data. Stock Assessment.

E N D
Fisheries Models:Methods, Data Requirements, Environmental Linkages Richard Methot NOAA Fisheries Science & Technology
PRESENTATION OUTLINE • Assessment Goals • What is a “Stock Assessment”? • Data Inputs • Assessment Methods • Role of Environmental Data Stock Assessment Overview
Stock Assessment • Collecting, analyzing, and reporting demographic information for the purpose of determining the effects of fishing on fish populations. • Key Concepts / Jargon • Stock; Population; Unit • Abundance; Biomass; Spawning Biomass • Recruitment; Yearclass; Cohort • Fishery • Fishing mortality (F); Exploitation Rate Stock Assessment Overview
STOCK ASSESSMENT PROCESS CATCH LOGBOOKS, OBSERVERS, AGE/SIZE DATA ABUNDANCE TREND RESOURCE SURVEY, FISHERY CPUE, AGE/SIZE DATA BIOLOGY AGE, GROWTH, MATURITY ADVANCED MODELS HABITAT CLIMATE ECOSYSTEM MANMADE STRESS POPULATION MODEL: (Abundance, mortality) SOCIOECONOMICS FORECAST STOCK STATUS OPTIMUM YIELD Stock Assessment Overview
STOCK ASSESSMENT & ECOSYSTEM TIME SERIES OF RESULTS BIOMASS, RECRUITMENT, GROWTH, MORTALITY SINGLE SPECIES ASSESSMENT MODEL SHORT-TERM OPTIMUM YIELD LONG-TERM HOLISTIC ECOSYSTEM MODEL CUMULATIVE EFFECTS OF ALL FISHERIES AND OTHER FACTORS INDICATORS ENVIRONMENTAL, ECOSYSTEM, OCEANOGRAPHIC RESEARCH ON INDICATOR EFFECTS TWO-WAY Stock Assessment Overview
Assessment ResultsUsed in Fishery Management • Monitoring / Reactive • Exploitation rate is higher than a maximum limit: • overfishing is occurring and must be eliminated; • biomass is below a minimum level: • the stock is overfished (depleted). A rebuilding plan must be prepared to rebuild the stock in as short a time as possible; • Proactive • Assessment forecasts provide the technical basis (operational model) for setting and adjusting fishery quotas and other management measures to: • implement harvest policies • Rebuild depleted stocks Stock Assessment Overview
HARVEST CONTROL RULE= OPERATIONAL MODEL What level of fishing mortality (F) is the limit (RED) and target (GREEN)? What level of short-term future catch would achieve target? What is the current stock abundance relative to historical and target levels? Stock Assessment Overview
FISHING REDUCES LIFETIME EGG PRODUCTION Stock Assessment Overview
DIRECT FISHING EFFECTSYield per Recruit and Eggs (Spawning Biomass) per Recruit Stock Assessment Overview
Assessment Inputs • STOCK STRUCTURE: Spatial limits of demographic unit • TOTAL CATCH: total removals due to human activities (due to fishery landings, discarded bycatch, and cryptic mortality due to encounters with fishing gear); • SURVEYS: the relative or absolute magnitude of a fish population (by age); • LIFE HISTORY: growth, maturation, fecundity, natural mortality, and other characteristics of individual fish. Stock Assessment Overview
What is a “Stock”? • A group of individuals of the same species that: • inhabit the same geographic region; • interbreed when mature; • have sufficiently high levels of diffusion/mixing Northern Stock High mixing within Low mixing between Southern Stock Stock Assessment Overview
Pillar I - Catch DataFisheries Information System • Commercial fishing effort, catch, and value • Dealer reports • Vessel trip reports • Recreational fishing effort and catch • Telephone surveys • Shoreside sampling surveys • Size and age structure of catch • Commercial catch sampling surveys • Recreational catch sampling surveys • Electronic dissemination of data • Serves stock assessment, economic analysis, and fishery monitoring needs Stock Assessment Overview
Fishery Observers Since 1972 NOAA Fisheries has deployed fishery observers to collect catch and bycatch data from US and foreign commercial fishing and processing vessels. Today, 42 fisheries all around the nation are monitored by observer programs logging over 60,000 observer days at sea. Data support fish stock assessment, fishery monitoring, protected species mortality monitoring, and other conservation and management programs. Stock Assessment Overview
Pillar II - Abundance IndexFishery-Independent Surveys • Catch/Effort = q * Abundance • Survey sampling units (effort) is highly standardized; • Sampling follows a statistical design; • Assert that q is sufficiently constant; • Sometimes, q can be measured directly, so survey catch rate can be transformed directly to measure of abundance Stock Assessment Overview
Fishery-Independent Surveys 10 NOAA Ships Plus 1768 charter DAS Stock Assessment Overview
Fishery CPUE as Abundance Index • Fishery Catch = q * Effort * Abundance • So • Catch/Effort = q * Abundance • Unfortunately, • Fishing effort is very hard to standardize, so the effective q may not be constant; • Fishing tends to occur where abundance is high, not where abundance is average. Stock Assessment Overview
Advanced Technology • Autonomous Underwater Vehicle • Contains cameras, sensors, acoustics • Reach into habitats inaccessible to other survey tools Stock Assessment Overview
Pillar III - Fish Biology / Life History Ease: Length > Weight >> Age > Eggs & Maturity >>> Mortality Stock Assessment Overview
STOCK ASSESSMENT LOGICEstimating Abundance • How big must stock have been if: • We saw a relative decline of X% per year in the survey index; • While Y tons of catch were removed per year; • And the stock’s biology indicates that natural changes in abundance are only +/-Z% per year Stock Assessment Overview
BASIC ASSESSMENT APPROACHES • Index Methods • Is stock abundance: • Increasing, decreasing, or stable? • Equilibrium Methods • On average, is fishing mortality: • too high, too low, or just right? • Dynamic Population Methods • Estimates time series of stock abundance and mortality • Forecast stock abundance and catch level that maintains mortality target • Can be biomass-based, but age & size structure provide more detail, especially for forecasting • Choice depends on data availability and complexity of management questions Stock Assessment Overview
Trend in Survey Abundance Index • Lack of fit due to: • Sampling variability of the observations • Environmental data can improve stratification and adaptive sampling • Unknown changes in the calibration, q • Environmental data can inform about changes in availability of fish to the survey • Other Data in Model: • Recruitment index for some years • Proportion at each age in the fishery • Total catch Stock Assessment Overview
INTEGRATED ANALYSIS • Ability to use various age, length, abundance data to calibrate model • Smoothly transitions from pre-data era, to data-rich era, to forecast. • Produces estimates of model uncertainty Stock Assessment Overview
CONSTANT Assert, Believe!, Hope!! To Be Stable Over Time Traditional Data Provide Little Information To Estimate Variability Examples: Natural Mortality Survey Catchability Average Spawner-Recruitment Relationship VARIABLE Expected To Vary Over Time Data Are Informative About Fluctuations Examples: Fishing Mortality Annual Recruitment Growth and Maturity Changes MODEL PROCESSES Stock Assessment Overview
PRODUCTIVITY High productivity stocks maintain high recruitment levels even as stock abundance declines. They rebuild quickly as fishing mortality is reduced. Low productivity stocks can sustain only low fishing mortality rates. They require multiple generations to rebuild from low biomass levels. Short-term (annual) environmental variability obscures these ecological relationships Long-term (decadal) environmental and ecosystem shifts are confounded with relationships Stock Assessment Overview
ENVIRONMENTAL DATA &“VARIABLE” PROCESSES Recruitment = f(biomass, environment, ecosystem) + e • Including environmental component in model can: • Reduce alias in estimate of biomass linkage caused by long-term environmental patterns; • Provide additional information on historical fluctuations during data-poor periods; • Provide early indicators of upcoming fluctuations. • Similar situation for environmental effects on body growth • Ecosystem effects are harder! Stock Assessment Overview
ENVIRONMENTAL DATA &CONSTANT PROCESSES • New Information About Changes In “Constant” Processes • Need Validation Outside Model • EXAMPLES: • Predators Affect Natural Mortality • Spatial Distribution Affects Catchability • Thermocline Depth Affects Catchability • PDO Regime Affects Average Recruitment Stock Assessment Overview
Fisheries And The EnvironmentFATE A NOAA Fisheries Oceanographic Program Supporting NOAA’s mission to ensure the sustainable use of US fishery resources under a changing climate
A FATE Ecosystem Indicator Peterson et al.; Northwest Fisheries Science Center This function can be used to predict returns of salmon the following year; copepod anomalies from 2001 predict that about 10% of the juvenile salmon that went to sea in spring 2001 will return to spawn in fall 2002. Stock Assessment Overview
Sablefish Recruitment VariabilityMichael J. Schirripa and Jim J. ColbertNorthwest Fisheries Science Center, Oregon State UniversityRecruitment is fit to stock biomass as well as annual deviations in the Spring sea level anomalies. This made possible estimates of current year-class strengths Stock Assessment Overview
Stock Assessment Overview Evan Howell and Jeff Polovina, Pacific Islands Fishery Science Center
CA Chinook Growth and Maturation Vary with the Environment Using variables related to oceanic conditions* we can fit growth rates for individual California cohorts and the probability that a cohort will mature after the third ocean winter at sea. *e.g. Wind Turbulence, Upwelling, Sea Level Height, Sea Surface Temperature. 1981 cohort STD Growth rate Growth year Proportion maturing after 3 OW Brood year (cohort) B. Wells, C. Grimes, J. Field, C. Reiss; Southwest Fisheries Science Center Stock Assessment Overview
CONCLUSIONS • Environmental information can improve precision and accuracy of fish assessments by providing: • Info on large scale changes in spatial distribution; • Info on factors affecting fish behavior and availability to surveys; • Info of factors affecting spatial distribution in fishing effort; • Indicators to adjust mortality and growth factors otherwise held constant; • Indicators to forecast upcoming fluctuations in highly variable recruitment Stock Assessment Overview