Download
1 / 1
10 likes | 89 Views
Marker. cM. D4-196. 16.4. D4-214. 21.9. D4-17. 29.5. D4-26. 35.0. D4-9 / D4-166. 39.3. D4-255. D4-155. 45.9. 48.1. D4-199. 52.5. D4-203. D4-204. 60.1. 61.2. D4-251. 66.7. D4-170. D4-232. 69.9. 71.0. APN. C1. C3H. C4. C9.

E N D
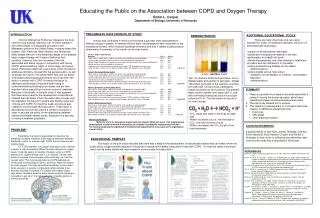
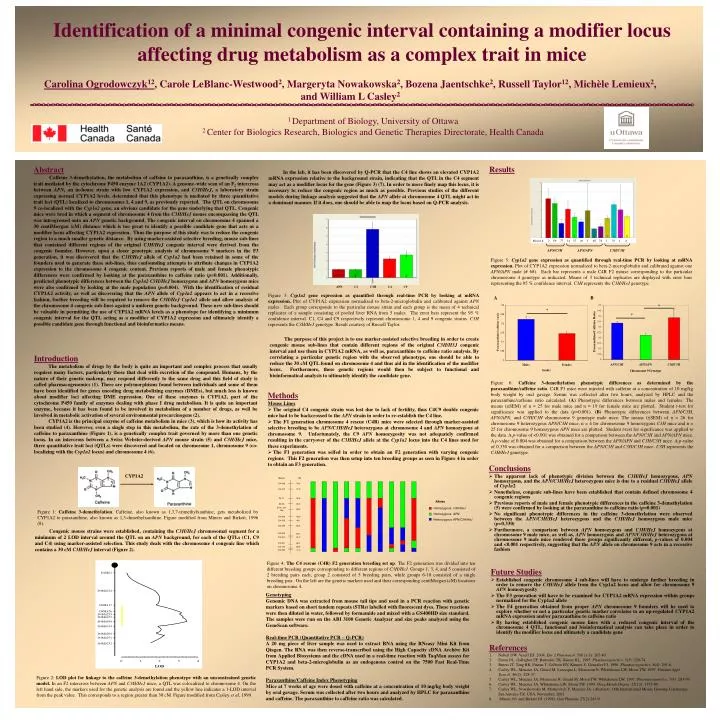
Marker cM D4-196 16.4 D4-214 21.9 D4-17 29.5 D4-26 35.0 D4-9 / D4-166 39.3 D4-255 D4-155 45.9 48.1 D4-199 52.5 D4-203 D4-204 60.1 61.2 D4-251 66.7 D4-170 D4-232 69.9 71.0 APN C1 C3H C4 C9 Identification of a minimal congenic interval containing a modifier locusaffecting drug metabolism as a complex trait in mice Carolina Ogrodowczyk12, Carole LeBlanc-Westwood2, Margeryta Nowakowska2, Bozena Jaentschke2, Russell Taylor12, Michèle Lemieux2, and William L Casley2 1 Department of Biology, University of Ottawa 2 Center for Biologics Research, Biologics and Genetic Therapies Directorate, Health Canada Results Abstract Caffeine 3-demethylation, the metabolism of caffeine to paraxanthine, is a genetically complex trait mediated by the cytochrome P450 enzyme 1A2 (CYP1A2). A genome–wide scan of an F2 intercross between APN, an in-house strain with low CYP1A2 expression, and C3H/HeJ, a laboratory strain expressing normal CYP1A2 levels, determined that this phenotype is mediated by three quantitative trait loci (QTL) localized to chromosomes 1, 4 and 9, as previously reported. The QTL on chromosome 9 co-localized with the Cyp1a2 gene, an obvious candidate for the gene underlying that QTL. Congenic mice were bred in which a segment of chromosome 4 from the C3H/HeJ mouse encompassing the QTL was introgressed onto an APN genetic background. The congenic interval on chromosome 4 spanned a 30 centiMorgan (cM) distance which is too great to identify a possible candidate gene that acts as a modifier locus affecting CYP1A2 expression. Thus the purpose of this study was to reduce the congenic region to a much smaller genetic distance. By using marker-assisted selective breeding, mouse sub-lines that contained different regions of the original C3H/HeJ congenic interval were derived from the congenic founder. However, upon a closer genotypic analysis of chromosome 9 markers in the F3 generation, it was discovered that the C3H/HeJ allele of Cyp1a2 had been retained in some of the founders used to generate these sub-lines, thus confounding attempts to attribute changes in CYP1A2 expression to the chromosome 4 congenic content. Previous reports of male and female phenotypic differences were confirmed by looking at the paraxanthine to caffeine ratio (p=0.001). Additionally, predicted phenotypic differences between the Cyp1a2C3H/HeJ homozygous and APN homozygous mice were also confirmed by looking at the male population (p=0.004). With the identification of residual CYP1A2 activity, as well as discovering that the APN allele of Cyp1a2 appears to act in a recessive fashion, further breeding will be required to remove the C3H/HeJCyp1a2 allele and allow analysis of the chromosome 4 congenic sub-lines against a uniform genetic background. These new sub-lines should be valuable in permitting the use of CYP1A2 mRNA levels as a phenotype for identifying a minimum congenic interval for the QTL acting as a modifier of CYP1A2 expression and ultimately identify a possible candidate gene through functional and bioinformatics means. In the lab, it has been discovered by Q-PCR that the C4 line shows an elevated CYP1A2 mRNA expression relative to the background strain, indicating that the QTL in the C4 segment may act as a modifier locus for the gene (Figure 3) (7). In order to more finely map this locus, it is necessary to reduce the congenic region as much as possible. Previous studies of the different models during linkage analysis suggested that the APN allele at chromosome 4 QTL might act in a dominant manner. If it does, one should be able to map the locus based on Q-PCR analysis. Mouse # 2 69 77 14 37 49 5 68 78 1 33 4 6 APN/C3H APN/APN C3H/C3H Figure 5: Cyp1a2 gene expression as quantified through real-time PCR by looking at mRNA expression. Plot of CYP1A2 expression normalized to beta-2-microglobulin and calibrated against one APN/APN male (# 68). Each bar represents a male C4R F2 mouse corresponding to the particular chromosome 4 genotype as indicated. Means of 3 technical replicates are displayed with error bars representing the 95 % confidence interval. C3H represents the C3H/HeJ genotype. Figure 3: Cyp1a2 gene expression as quantified through real-time PCR by looking at mRNA expression. Plot of CYP1A2 expression normalized to beta-2-microglobulin and calibrated against APN males. Each group corresponds to the particular mouse strain and each group is the mean of 4 technical replicates of a sample consisting of pooled liver RNA from 5 males. The error bars represent the 95 % confidence interval. C1, C4 and C9 respectively represent chromosome 1, 4 and 9 congenic strains. C3H represents the C3H/HeJ genotype. Result courtesy of Russell Taylor. A B * * * The purpose of this project is to use marker-assisted selective breeding in order to create congenic mouse sub-lines that contain different regions of the original C3H/H3J congenic interval and use them in CYP1A2 mRNA, as well as, paraxanthine to caffeine ratio analysis. By correlating a particular genetic region with the observed phenotype, one should be able to reduce the 30 cM QTL found on chromosome 4 and thus aid in the identification of the modifier locus. Furthermore, these genetic regions would then be subject to functional and bioinformatical analysis to ultimately identify the candidate gene. Introduction The metabolism of drugs by the body is quite an important and complex process that usually requires many factors, particularly those that deal with excretion of the compound. Humans, by the nature of their genetic makeup, may respond differently to the same drug and this field of study is called pharmacogenomics (1). There are polymorphisms found between individuals and some of them have been identified for genes encoding drug metabolizing enzymes (DMEs), but much less is known about modifier loci affecting DME expression. One of these enzymes is CYP1A2, part of the cytochrome P450 family of enzymes dealing with phase I drug metabolism. It is quite an important enzyme, because it has been found to be involved in metabolism of a number of drugs, as well be involved in metabolic activation of several environmental procarcinogens (2). CYP1A2 is the principal enzyme of caffeine metabolism in mice (3), which is how its activity has been studied (4). However, even a single step in this metabolism, the rate of the 3-demethylation of caffeine to paraxanthine (Figure 1), is a genetically complex trait governed by more than one genetic locus. In an intercross between a Swiss Webster-derived APN mouse strain (5) and C3H/HeJ mice, three quantitative trait loci (QTLs) were discovered and located on chromosome 1, chromosome 9 (co-localizing with the Cyp1a2 locus) and chromosome 4 (6). Figure 6: Caffeine 3-demethylation phenotypic differences as determined by the paraxanthine/caffeine ratio. C4R F3 mice were injected with caffeine at a concentration of 10 mg/kg body weight by oral gavage. Serum was collected after two hours, analyzed by HPLC and the paraxanthine/caffeine ratio calculated. (A) Phenotypic differences between males and females. The means (±SEM) of n = 25 for male mice and n = 19 for female mice are plotted. Student t-test for significance was applied to the data (p=0.001). (B) Phenotypic differences between APN/C3H, APN/APN, and C3H/C3H chromosome 9 genotype male mice. The means (±SEM) of n = 26 for chromosome 9 heterozygous APN/C3H mice, n = 4 for chromosome 9 homozygous C3H mice and n = 25 for chromosome 9 homozygous APN mice are plotted. Student t-test for significance was applied to the data. A p-value of <0.001 was obtained for a comparison between the APN/C3H and APN/APN mice. A p-value of 0.004 was obtained for a comparison between the APN/APN and C3H/C3H mice. A p-value of 0.330 was obtained for a comparison between the APN/C3H and C3H/C3H mice. C3H represents the C3H/HeJ genotype. • Methods • Mouse Lines • The original C4 congenic strain was lost due to lack of fertility, thus C4C9 double congenic mice had to be backcrossed to the APN strain in order to re-establish the C4 line. • The F1 generation chromosome 4 rescue (C4R) mice were selected through marker-assisted selective breeding to be APN/C3H/HeJ heterozygous at chromosome 4 and APN homozygous at chromosome 9. Unfortunately, the C9 APN homozygosity was not adequately confirmed resulting in the carryover of the C3H/HeJ allele at the Cyp1a2 locus into the C4 lines used for these experiments. • The F1 generation was selfed in order to obtain an F2 generation with varying congenic regions. This F2 generation was then setup into ten breeding groups as seen in Figure 4 in order to obtain an F3 generation. Conclusions • The apparent lack of phenotypic division between the C3H/HeJ homozygous, APN homozygous, and the APN/C3H/HeJ heterozygous mice is due to a residual C3H/HeJ allele of Cyp1a2 • Nonetheless, congenic sub-lines have been established that contain defined chromosome 4 congenic regions • Previous reports of male and female phenotypic differences in the caffeine 3-demethylation (5) were confirmed by looking at the paraxanthine to caffeine ratio (p=0.001) • No significant phenotypic differences in the caffeine 3-demethylation were observed between the APN/C3H/HeJ heterozygous and the C3H/HeJ homozygous male mice (p=0.330) • Furthermore, a comparison between APN homozygous and C3H/HeJ homozygous at chromosome 9 male mice, as well as, APN homozygous and APN/C3H/HeJ heterozygous at chromosome 9 male mice rendered these groups significantly different, p-values of 0.004 and <0.001 respectively, suggesting that the APN allele on chromosome 9 acts in a recessive fashion CYP1A2 Alleles Homozygous C3H/HeJ Figure 1: Caffeine 3-demethylation. Caffeine, also known as 1,3,7-trimethylxanthine, gets metabolized by CYP1A2 to paraxanthine, also known as 1,3-dimethylxanthine. Figure modified from Miners and Birkett, 1996 (8). Homozygous APN Heterozygous APN/C3H/HeJ Congenic mouse strains were established, containing the C3H/HeJ chromosomal segment for a minimum of 2 LOD interval around the QTL on an APN background, for each of the QTLs (C1, C9 and C4) using marker-assisted selection. This study deals with the chromosome 4 congenic line which contains a 30 cM C3H/HeJ interval (Figure 2). Figure 4: The C4 rescue (C4R) F2 generation breeding set up. The F2 generation was divided into ten different breeding groups corresponding to different regions of C3H/HeJ. Groups 1, 3, 4, and 5 consisted of 2 breeding pairs each; group 2 consisted of 5 breeding pairs, while groups 6-10 consisted of a single breeding pair. On the left are the genetic markers used and their corresponding centiMorgan (cM) locations on chromosome 4. Future Studies • Established congenic chromosome 4 sub-lines will have to undergo further breeding in order to remove the C3H/HeJ allele from the Cyp1a2 locus and allow for chromosome 9 APN homozygosity • The F3 generation will have to be examined for CYP1A2 mRNA expression within groups normalized for the Cyp1a2 allele • The F4 generation obtained from proper APN chromosome 9 founders will be used to explore whether or not a particular genetic marker correlates to an up-regulated CYP1A2 mRNA expression and/or paraxanthine to caffeine ratio • By having established congenic mouse lines with a reduced congenic interval of the chromosome 4 QTL, functional and bioinformatical analysis can take place in order to identify the modifier locus and ultimately a candidate gene Genotyping Genomic DNA was extracted from mouse tail tips and used in a PCR reaction with genetic markers based on short tandem repeats (STRs) labelled with fluorescent dyes. These reactions were then diluted in water, followed by formamide and mixed with a GS400HD size standard. The samples were run on the ABI 3100 Genetic Analyzer and size peaks analyzed using the GeneScan software. Real-time PCR (Quantitative PCR – Q-PCR) A 20 mg piece of liver sample was used to extract RNA using the RNeasy Mini Kit from Qiagen. The RNA was then reverse-transcribed using the High Capacity cDNA Archive Kit from Applied Biosystems and the cDNA used in a real-time reaction with TaqMan assays for CYP1A2 and beta-2-microglobulin as an endogenous control on the 7500 Fast Real-Time PCR System. Paraxanthine/Caffeine Index Phenotyping Mice at 7 weeks of age were dosed with caffeine at a concentration of 10 mg/kg body weight by oral gavage. Serum was collected after two hours and analyzed by HPLC for paraxanthine and caffeine. The paraxanthine to caffeine ratio was calculated. • References • Nebert DW, Vesell ES. 2004. Eur J Pharmacol. 500 (1-3): 267-80. • Eaton DL, Gallagher EP, Bammler TK, Kunze KL. 1995. Pharmacogenetics. 5(5): 259-74. • Buters JT, Tang BK, Pineau T, Gelboin HV, Kimura S, Gonzalez FJ. 1996. Pharmacogenetics. 6(4): 291-6. • Casley WL, Menzies JA, Girard M, Larocque L, Mousseau N, Whitehouse LW, Moon TW. 1997. Fundam Appl Toxicol. 40(2): 228-37. • Casley WL, Menzies JA, Mousseau N, Girard M, Moon TW, Whitehouse LW. 1997. Pharmacogenetics. 7(4): 283-93. • Casley WL. Menzies JA, Whitehouse LW, Moon TW. 1999. Drug Metab Dispos. 27(12): 1375-80. • Casley WL, Nowakowska M, Markovitch Y, Menzies JA. (Abstract). 16th International Mouse Genome Conference, San Antonio TX, USA, November, 2002 • Miners JO, and Birkett DJ. (1996). Gen Pharmac 27(2):245-9. Figure 2: LOD plot for linkage to the caffeine 3-demethylation phenotype with an unconstrained genetic model. In an F2 intercross between APN and C3H/HeJ mice, a QTL was colocalized to chromosome 4. On the left hand side, the markers used for the genetic analysis are found and the yellow line indicates a 1-LOD interval from the peak value. This corresponds to a region greater than 30 cM. Figure modified from Casley et al, 1999.