Download
1 / 27
270 likes | 451 Views
Healthy People 2010 Focus Area 15: Injury and Violence Prevention Progress Review August 16, 2007. Leading Causes of Death, 2004. Source: Source: National Vital Statistics System—Mortality (NVSS-M), NCHS, CDC. Leading Causes of Unintentional Injury Deaths, 2004.

E N D
Healthy People 2010 Focus Area 15:Injury and Violence PreventionProgress ReviewAugust 16, 2007
Leading Causes of Death, 2004 Source: Source: National Vital Statistics System—Mortality (NVSS-M), NCHS, CDC.
Leading Causes of Unintentional Injury Deaths, 2004 Note: Fires/burns includes all fire deaths, not just those that occurred in residences. Healthy People 2010 objective 15-25, highlighted later in this presentation, focuses exclusively on residential fire deaths. Source: Source: National Vital Statistics System—Mortality (NVSS-M), NCHS, CDC.
Burden of Injury and Violence • Injuries are the leading cause of death for people ages 1-44. • Injuries and violence resulted in 167,000 deaths in 2004. • Each year: • 50 million injury episodes require medical attention, costing $406 billion in medical expenses and lost productivity. • 1.4 million people sustain a traumatic brain injury. • 396,000 residential fires result in 3,000 deaths and nearly 14,000 ED visits for injuries. • 1 in 3 adults 65 years and over fall, resulting in about 15,000 deaths. • More than 1 in 7 children experience maltreatment. • Approximately 200,000 people are victims of rape or sexual assault.
Status of Injury Prevention Objectives 15-7. Nonfatal poisonings 15-8. Deaths from poisoning 15-9. Deaths from suffocation 15-10. Emergency department surveillance of external causes of injury 15-11. Hospital discharge surveillance of external causes of injury 15-12. Emergency department visits due to injury or poisoning 15-1. Traumatic brain injury hospitalizations 15-2. Nonfatal spinal cord injury hospitalizations 15-3. Firearm-related deaths 15-4. Improper firearm storage in homes 15-5. Nonfatal firearm-related injuries 15-6. State-level child fatality review Baseline only Little or no change* Getting worse Target met/exceeded Improving * Percent of targeted change achieved is between -10% and 10%.
Status of Unintentional Injury Prevention Objectives 15-23a-b. Bicycle helmet use 15-24. Bicycle helmet laws 15-25. Residential fire deaths 15-26a. Functioning smoke alarms in residences (prop. of persons) 15-26a. Functioning smoke alarms in residences (prop. of homes) 15-27. Deaths from falls 15-28a. Hip fractures in older females 15-28b. Hip fractures in older males 15-29. Drownings 15-30. ED visits for dog bite injuries 15-31a-c. Protective gear in school sports 15-13. Deaths from unintentional injuries 15-14. Nonfatal unintentional injuries 15-15a. Motor vehicle crash deaths (per 100,000) population 15-15b. Motor vehicle crash deaths (per million miles traveled) 15-16. Pedestrian deaths 15-17. Nonfatal motor vehicle injuries 15-18. Nonfatal pedestrian injuries 15-19. Safety belt use 15-20. Child restraint use 15-21. Motorcycle helmet use 15-22. Graduated driver licensing laws Baseline only Little or no change* Getting worse Target met/exceeded Improving * Percent of targeted change achieved is between -10% and 10%.
Status of Violence and Abuse Prevention Objectives 15-32. Homicides 15-33a. Child maltreatment incidents 15-33b. Child maltreatment fatalities 15-34. Physical assault by intimate partners 15-35. Rape or attempted rape 15-36. Sexual assault other than rape 15-37. Physical assaults 15-38. Physical fighting among adolescents 15-39. Weapon carrying by adolescents on school property Baseline only Little or no change* Getting worse Target met/exceeded Improving * Percent of targeted change achieved by most recent data point is between -10% and 10%.
Status of Injury and Violence Prevention Objectives * Percent of targeted change achieved is between -10% and 10%.
Status of Highlighted Objectives * Percent of targeted change achieved is between -10% and 10%.
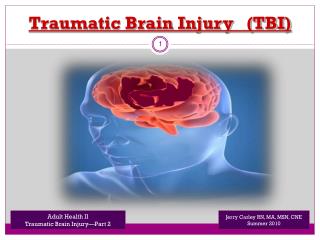
Traumatic Brain Injury (TBI) Hospitalizations Age-adjusted rate per 100,000 population Decrease desired 2010 Target: 41.2 Male 15-24 yrs* Female * Data for males 15-24 years are not age adjusted. Note: TBI is defined as an injury to the head that is documented in a medical record, with one or more of the following conditions attributed to head injury: observed or self-reported decreased level of consciousness, amnesia, skull fracture, objective neurological or neuropsychological abnormality, or diagnoses intracranial lesion. Data are age adjusted to the 2000 standard population. Source: National Hospital Discharge Survey (NHDS), NCHS, CDC. Obj. 15-1 Male
TBI Hospitalizations Rate per 100,000 population Decrease desired Note: TBI is defined as an injury to the head that is documented in a medical record, with one or more of the following conditions attributed to head injury: observed or self-reported decreased level of consciousness, amnesia, skull fracture, objective neurological or neuropsychological abnormality, or diagnoses intracranial lesion. Source: National Hospital Discharge Survey (NHDS), NCHS, CDC. Obj. 15-1 75+ yrs 65-74 yrs <65 yrs
Unintentional Residential Fire Deaths, 2004 Decrease desired 2010 Target: 0.2 Age-adjusted rate per 100,000 population 8% decrease (1999-2004) Age-adjusted rate per 100,000 population = 95% confidence interval. Note: Based on ICD-10 codes X00-X09 (location = HOME). Data are age adjusted to the 2000 standard population. Education estimates are based on persons aged 25-64 years. Source: National Vital Statistics System—Mortality (NVSS-M), NCHS, CDC. Obj. 15-25 Total Female Male Less than high school High school At least some college 0 0.5 1.0 1.5 2.0 2.5 3.0 3.5 4.0
Unintentional Residential Fire Deaths, 2004 Decrease desired 2010 Target: 0.2 Age-adjusted rate per 100,000 population = 95% confidence interval. Note: Based on ICD-10 codes X00-X09 (location = HOME). Data are age adjusted to the 2000 standard population. American Indian includes Alaska Native. Asian includes Pacific Islander. Black and white exclude persons of Hispanic origin. Persons of Hispanic origin may be of any race. One or more races could be recorded. Data by single race categories are for persons for whom only one racial group was recorded. Source: National Vital Statistics System—Mortality (NVSS-M), NCHS, CDC. Obj. 15-25 Total American Indian Asian Hispanic White Black Black females Black males 0 0.5 1.0 1.5 2.0 2.5 3.0 3.5 4.0
Unintentional Residential Fire Deaths, 2004 Rate per 100,000 population Decrease desired I = 95% confidence interval. Obj. 15-25 Note: Based on ICD-10 codes X00-X09 (location = HOME). Source: National Vital Statistics System—Mortality (NVSS-M), NCHS, CDC. 0-4 yrs 5-18 yrs 19-44 yrs 75-84 yrs 45-64 yrs 65-74 yrs 85+ yrs
Unintentional Residential Fire Deaths, 2000-2004 N = 2,803/year D.C. Age-adjusted rate per 100,000 (by quartiles) 1.33-3.05 0.98-1.32 0.77-0.97 0.28-0.76 Unreliable* * Rate is based on fewer than 20 deaths. Note: Based on ICD-10 codes X00-X09 (location = HOME). Data are age adjusted to the 2000 standard population. Source: National Vital Statistics System—Mortality (NVSS-M), NCHS, CDC. Obj. 15-25
Deaths Due to Unintentional Falls Rate per 100,000 population 1999 2004 Decrease desired Age-adjusted rate per 100,000 population 0-18 yrs 19-44 yrs 75-84 yrs 45-64 yrs 65-74 yrs 85+ yrs I = 95% confidence interval. Obj. 15-27 Note: Based on ICD-10 codes W00-W19. Trend data shown in insert are adjusted to the 2000 standard population.Source: National Vital Statistics System—Mortality (NVSS-M), NCHS, CDC.
Deaths Due to Unintentional Falls, 2004 Decrease desired Total American Indian Asian Black White Hispanic Female Male Less than high school High school At least some college 2010 Target: 3.3 0 2 4 6 8 10 Age-adjusted rate per 100,000 population = 95% confidence interval. Note: Based on ICD-10 codes W00-W19. Data are age adjusted to the 2000 standard population. American Indian includes Alaska Native. Asian includes Pacific Islander. Black and White exclude persons of Hispanic origin. Persons of Hispanic origin may be of any race. One or more races could be recorded. Data by single race categories are for persons for whom only one racial group was recorded. Education estimates are based on persons aged 25-64 years. Source: National Vital Statistics System—Mortality (NVSS-M), NCHS, CDC. Obj. 15-27
Deaths Due to Unintentional Falls Among Persons 65 and Over, 2000-2004 N = 12,667/year D.C. Age-adjusted rate per 100,000 (by quartiles) 49.0-80.4 35.7-48.9 29.3-35.6 16.5-29.2 Note: Based on ICD-10 codes W00-W19. Data are age adjusted to the 2000 standard population. Source: National Vital Statistics System—Mortality (NVSS-M), NCHS, CDC. Obj. 15-27
Child Maltreatment Incidents and Deaths Males Females Decrease desired Incidents per 1,000 children Deaths per 100,000 children 2010 Target: 10.1 2010 Target: 1.5 Note: Children are defined as persons under 18 years of age or persons considered minors under State law. Incidents rate includes some child maltreatment deaths. Number of reporting States varies by year. Obj. 15-33a,b Source: National Child Abuse and Neglect System (NCANDS), ACF.
Child Maltreatment Incidents, 2005 Incidents per 1,000 children Decrease desired 4-7 yrs 0-3 yrs 16-17 yrs 8-11 yrs 12-15 yrs Note: Children are defined as persons under 18 years of age or persons considered minors under State law. Incidents rate includes some child maltreatment deaths. Rates are based on data from 51 States. Obj. 15-33a Source: National Child Abuse and Neglect System (NCANDS), ACF.
Child Maltreatment Deaths, 2005 12-17 yrs*6% 8-11 yrs4% 42% < 1 yr 4-7 years13% 0-3 yrs77% 1 yr 17% 2 yr 12% 3 yr 6% * Includes some deaths to children 18 years or older who were considered minors under State law. Obj. 15-33b Note: Percentages are based on data from 36 reporting States. Source: National Child Abuse and Neglect System (NCANDS), ACF.
Child Maltreatment Deaths by Perpetrator’s Relationship to Child, 2005 Mother 10% Mother and father 29% 13% Mother and other 2% Father 16% Father and other 20% Non-parental perpetrator 10% Unknown or missing Note: Children are defined as persons under 18 years of age or persons considered minors under State law.Percentages are based on data from 34 reporting States. Obj. 15-33b Source: National Child Abuse and Neglect System (NCANDS), ACF.
Sexual Violence Incidents per 1,000 populationaged 12 years and over Decrease desired 2010 Target Rape or attempted rape Sexual assault other than rape Source: National Crime Victimization Survey (NCVS), U.S. Department of Justice, Bureau of Justice Statistics. Obj. 15-35 & 15-36
Rape/Sexual Assault Incidents, 2004-2005 Decrease desired White Black Other race Two or more races Hispanic Female Male 12-15 yrs. 16-19 yrs. 20-24 yrs. 25-34 yrs. 35-49 yrs. 50-64 yrs. * * * 0 1.0 2.0 3.0 4.0 5.0 Incidents per 1,000 population aged 12 years and over * Based on 10 or fewer sample cases; rate should be interpreted with caution. = 95% confidence interval. Note: The categories White, Black and Other race exclude persons of Hispanic origin. Other race includes American Indian, Alaska Native, Asian, and Native Hawaiian and Pacific Islander. Persons of Hispanic origin may be of any race. One or more races could be recorded. Data by single race categories are for persons for whom only one racial group was recorded. Source: National Crime Victimization Survey (NCVS), U.S. Department of Justice, Bureau of Justice Statistics. Obj. 15-35/15-36
Rape/Sexual Assault Against Females by Perpetrator’s Relationship to Victim, 2005 2% Intimate partner Other relative 26% 28% Friend or acquaintance Stranger 7%* Relationship unknown 38% * Based on 10 or fewer sample cases; percent should be interpreted with caution. Obj. 15-35/15-36 Note: Percentages sum to greater than 100% due to rounding. Source: National Crime Victimization Survey (NCVS), U.S. Department of Justice, Bureau of Justice Statistics.
Summary • About half (24/46) of the objectives have met or are moving toward their targets. • Rape and sexual assault have decreased since the baseline; both objectives have met their targets. • Disparities by age, gender, education and geographic location persist for many objectives.
Progress review data and slides are available on the web at: http://www.cdc.gov/nchs/hphome.htm