Download

1 / 125
1.3k likes | 1.51k Views
Complex Numbers. Complex Numbers. The imaginary unit i is defined as. Example. Complex Numbers.

E N D
Complex Numbers The imaginary unit i is defined as
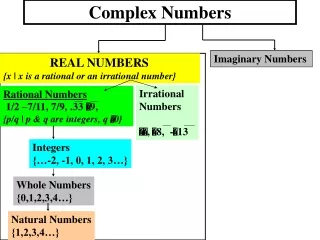
Complex Numbers • The set of all numbers in the form a+bi with real numbers a and b, and i, the imaginary unit, is called the set of complex numbers. The real number a is called the real part, and the real number b is called the imaginary part, of the complex number a+bi.
Equality of Complex Numbers • a+bi = c+di if and only if a = c and b = d
Adding and Subtracting Complex Numbers • (a+bi) + (c+di) = (a+b) + (c+d)i • (a+bi) - (c+di) = (a-c) + (b-d)i
Perform the indicated operation, writing the result in standard form. (-5 + 7i) - (-11 - 6i) Combine the real and imaginary parts: (-5-(-11)) + (7-(-6))i = (-5+11) + (7+6)i = 6+13i Text Example
Conjugate of a Complex Number • The complex conjugate of the number a+bi is a-bi, and the conjugate of a-bi is a+bi.
For any positive real number b, the principal square root of the negative number -b is defined by (-b) = ib Principal Square Root of a Negative Number
Graphs of Quadratic Functions The graph of any quadratic function is called a parabola. Parabolas are shaped like cups, as shown in the graph below. If the coefficient of x2 is positive, the parabola opens upward; otherwise, the parabola opens downward. The vertex (or turning point) is the minimum or maximum point.
The Standard Form of a Quadratic Function • The quadratic function • f (x)=a(x - h)2+ k, a 0 • is in standard form. The graph of f isa parabola whose vertex is the point (h, k). The parabola is symmetric to the line x = h. If a >0, the parabola opens upward; if a< 0, the parabola opens downward.
Graphing Parabolas With Equations in Standard Form • To graph f (x)=a(x - h)2+ k: • Determine whether the parabola opens upward or downward. If a >0, it opens upward. If a < 0, it opens downward. • Determine the vertex of the parabola. The vertex is (h, k). • Find any x-intercepts by replacing f (x) with 0. Solve the resulting quadratic equation for x. • Find the y-intercept by replacing x with zero. • Plot the intercepts and vertex. Connect these points with a smooth curve that is shaped like a cup.
SolutionWe can graph this function by following the steps in the preceding box. We begin by identifying values for a, h, and k. Standard formf (x)=a(x - h)2+ k a = -2 h=3 k=8 Given equationf (x)=-2(x- 3)2+ 8 Text Example • Graph the quadratic function f (x)=-2(x- 3)2+ 8. Step 1 Determine how the parabola opens. Note that a, the coefficient of x2, is -2. Thus, a < 0; this negative value tells us that the parabola opens downward.
2(x- 3)2= 8 Solve for x. Add 2(x- 3)2 to both sides of the equation. Text Example cont. Step 2 Find the vertex. The vertex of the parabola is at (h, k). Because h =3and k =8, the parabola has its vertex at (3, 8). Step 3 Find the x-intercepts.Replace f(x) with 0 in f(x)=-2(x- 3)2+ 8. 0 =-2(x- 3)2+ 8Find x-intercepts, setting f(x) equal to zero. (x- 3)2= 4 Divide both sides by 2. (x- 3) =±2 Apply the square root method. x- 3= -2 or x- 3= 2 Express as two separate equations. x= 1 or x= 5Add 3 to both sides in each equation. The x-interceptsare 1 and 5. The parabola passes through (1, 0) and (5, 0).
Step 4 Find the y-intercept. Replace xwith 0 in f(x)=-2(x- 3)2+ 8. f(0) =-2(0 - 3)2+ 8=-2(-3)2+ 8 = -2(9) + 8=-10 The y-intercept is –10.The parabola passes through (0, -10). Text Example cont. Step 5 Graph the parabola.With a vertex at (3, 8), x-intercepts at 1 and 5, and a y-intercept at –10, the axis of symmetry is the vertical line whose equation is x =3.
The Vertex of a Parabola Whose Equation Isf (x)=ax2+ bx + c • Consider the parabola defined by the quadratic function • f (x)=ax 2+ bx + c. The parabola's vertex is at
Example Graph the quadratic function f (x)=-x2+6x -. Solution: Step 1 Determine how the parabola opens. Note that a, the coefficient of x2, is -1. Thus, a < 0; this negative value tells us that the parabola opens downward. Step 2 Find the vertex. We know the x-coordinate of the vertex is x = -b/(2a). We identify a, b, and c to substitute the values into the equation for the x-coordinate: x = -b/(2a) = -6/2(-1)=3. The x-coordinate of the vertex is 3. We substitute 3 for x in the equation of the function to find the y-coordinate: y=f(3) = -(3)^2+6(3)-2=-9+18-2=7, the parabola has its vertex at (3,7).
Example Graph the quadratic function f (x)=-x2+6x -. • Step 3 Find the x-intercepts.Replace f(x) with 0 in f(x)=-x2+ 6x - 2. • 0 = -x2+ 6x - 2
Example Graph the quadratic function f (x)=-x2+6x -. • Step 4 Find the y-intercept. Replace xwith 0 in f(x)=-x2+ 6x - 2. • f(0) =-02+ 6 • 0 - 2=- • The y-intercept is –2.The parabola passes through (0, -2). • Step 5 Graph the parabola.
Minimum and Maximum: Quadratic Functions • Consider f(x) = ax2 + bx +c. • If a > 0, then f has a minimum that occurs at x = -b/(2a). This minimum value is f(-b/(2a)). • If a < 0, the f has a maximum that occurs at x = -b/(2a). This maximum value is f(-b/(2a)).
Strategy for Solving Problems Involving Maximizing or Minimizing Quadratic Functions • Read the problem carefully and decide which quantity is to be maximized or minimized. • Use the conditions of the problem to express the quantity as a function in one variable. • Rewrite the function in the form f(x) = ax2 + bx +c. • Calculate -b/(2a). If a > 0, then f has a minimum that occurs at x = -b/(2a). This minimum value is f(-b/(2a)). If a < 0, the f has a maximum that occurs at x = -b/(2a). This maximum value is f(-b/(2a)). • Answer the question posed in the problem.
Definition of a Polynomial Function Let n be a nonnegative integer and let an, an-1,…, a2, a1, a0, be real numbers with an¹ 0. The function defined by f (x)=anxn+ an-1xn-1+…+a2x2+ a1x + a0 is called a polynomial function of xof degree n. The number an, the coefficient of the variable to the highest power, is called the leading coefficient.
Two important features of the graphs of polynomial functions are that they are smooth and continuous. By smooth, we mean that the graph contains only rounded curves with no y y sharp corners. By continuous, we mean that the graph has no breaks and can be drawn without lifting your pencil from the rectangular coordinate system. These ideas are illustrated in the figure. Smooth rounded corner Smooth rounded corner x x Smooth rounded corner Smooth rounded corner Smooth, Continuous Graphs
As xincreases or decreases without bound, the graph of the polynomial function f (x)=anxn+ an-1xn-1+ an-2xn-2 +…+a1x + a0 (an¹ 0) eventually rises or falls. In particular, 1. For n odd: an> 0an< 0 If the leading coefficient is positive, the graph falls to the left and rises to the right. If the leading coefficient is negative, the graph rises to the left and falls to the right. Rises right Rises left Falls right Falls left The Leading Coefficient Test
As xincreases or decreases without bound, the graph of the polynomial function f (x)=anxn+ an-1xn-1+ an-2xn-2 +…+a1x + a0 (an¹ 0) eventually rises or falls. In particular, 1. For n even: an> 0an< 0 If the leading coefficient is positive, the graph rises to the left and to the right. If the leading coefficient is negative, the graph falls to the left and to the right. Rises right Rises left Falls left Falls right The Leading Coefficient Test
Rises right y x Falls left Text Example Use the Leading Coefficient Test to determine the end behavior of the graph of Graph the quadratic functionf(x)= x3+3x2-x- 3. SolutionBecause the degree is odd (n=3) and the leading coefficient, 1, is positive, the graph falls to the left and rises to the right, as shown in the figure.
Text Example Find all zeros of f(x)=-x4+4x3- 4x2. SolutionWe find the zeros of fby setting f(x)equal to 0. -x4+4x3- 4x2 = 0 We now have a polynomial equation. x4-4x3+ 4x2= 0 Multiply both sides by -1. (optional step) x2(x2- 4x+ 4) = 0 Factor out x2. x2(x- 2)2= 0 Factor completely. x2= 0 or (x- 2)2= 0 Set each factor equal to zero. x= 0 x= 2Solve for x.
Multiplicity and x-Intercepts If r is a zero of even multiplicity, then the graph touches the x-axis and turns around at r. If r is a zero of odd multiplicity, then the graph crosses the x-axis at r. Regardless of whether a zero is even or odd, graphs tend to flatten out at zeros with multiplicity greater than one.
Example • Find the x-intercepts and multiplicity of f(x) = 2(x+2)2(x-3) Solution: • x=-2 is a zero of multiplicity 2 or even • x=3 is a zero of multiplicity 1 or odd
Graphing a Polynomial Function f (x)=anxn+ an-1xn-1+ an-2xn-2 + ¼ +a1x + a0 (an¹ 0) • Use the Leading Coefficient Test to determine the graph's end behavior. • Find x-intercepts by setting f (x) = 0 and solving the resulting polynomial equation. If there is an x-intercept at r as a result of (x-r)k in the complete factorization of f (x), then: a. If k is even, the graph touches the x-axis at r and turns around. b. If k is odd, the graph crosses the x-axis at r. c. If k > 1, the graph flattens out at (r, 0). 3. Find the y-intercept by setting x equal to 0 and computing f (0).
Graphing a Polynomial Function f (x)=anxn+ an-1xn-1+ an-2xn-2 + ¼ +a1x + a0 (an¹ 0) • Use symmetry, if applicable, to help draw the graph: a.y-axis symmetry: f (-x) =f (x) b. Origin symmetry: f (-x) =-f (x). 5. Use the fact that the maximum number of turning points of the graph is n - 1 to check whether it is drawn correctly.
Solution Step 1 Determine end behavior. Because the degree is even (n = 4) and the leading coefficient, 1, is positive, the graph rises to the left and the right: y Rises left Rises right x Text Example Graph: f(x)=x4-2x2+ 1.
Text Example cont. Graph: f(x)=x4-2x2+ 1. Solution Step 2 Find the x-intercepts (zeros of the function) by settingf(x)=0. x4-2x2+ 1 = 0 (x2- 1)(x2- 1) = 0 Factor. (x+ 1)(x -1)(x+ 1)(x -1) = 0 Factor completely. (x+ 1)2(x- 1)2= 0 Express the factoring in more compact notation. (x+ 1)2= 0 or (x- 1)2= 0 Set each factor equal to zero. x=-1 x= 1Solve for x.
y Rises right Rises left x 1 1 Text Example cont. Graph: f(x)=x4-2x2+ 1. Solution Step 2We see that -1 and 1 are both repeated zeros with multiplicity 2. Because of the even multiplicity, the graph touches the x-axis at -1 and 1 and turns around. Furthermore, the graph tends to flatten out at these zeros with multiplicity greater than one:
y Rises right Rises left 1 x 1 1 Text Example cont. Graph: f(x)=x4-2x2+ 1. Solution Step 3 Find the y-intercept. Replace xwith 0 in f(x)=-x+ 4x - 1. f(0) =04- 2 • 02+ 1=1 There is a y-intercept at 1, so the graph passes through (0, 1).
Replace xwith -x. Text Example cont. Graph: f(x)=x4-2x2+ 1. Solution Step 4 Use possible symmetry to help draw the graph. Our partial graph suggests y-axis symmetry. Let's verify this by finding f(-x). f(x) =x4-2x2+ 1 f(-x)= (-x)4-2(-x)2+ 1 =x4-2x2+ 1 Because f(-x)= f(x), the graph of f is symmetric with respect to the y-axis. The following figure shows the graph.
y x Text Example cont. Graph: f(x)=x4-2x2+ 1. Solution Step 5 Use the fact that the maximum number of turning points of the graph is n- 1 to check whether it is drawn correctly. Because n= 4, the maximum number of turning points is 4 - 1, or 3. Because our graph has three turning points, we have not violated the maximum number possible.
Long Division of Polynomials • Arrange the terms of both the dividend and the divisor in descending powers of any variable. • Divide the first term in the dividend by the first term in the divisor. The result is the first term of the quotient. • Multiply every term in the divisor by the first term in the quotient. Write the resulting product beneath the dividend with like terms lined up. • Subtract the product from the dividend. • Bring down the next term in the original dividend and write it next to the remainder to form a new dividend. • Use this new expression as the dividend and repeat this process until the remainder can no longer be divided. This will occur when the degree of the remainder (the highest exponent on a variable in the remainder) is less than the degree of the divisor.
Solution We begin by writing the divisor and dividend in descending powers of x. Next, we consider how many times 3x divides into 6x3. Multiply. Divide: 6x3/3x = 2x2. 2x2 3x – 2 6x3 – x2 – 5x + 4 Multiply: 2x2(3x – 2) = 6x3 – 4x2. 6x3 – 4x2 Subtract 6x3 – 4x2 from 6x3 – x2 and bring down –5x. 3x2 – 5x Now we divide 3x2 by 3x to obtain x, multiply x and the divisor, and subtract. Multiply. Divide: 3x2/3x = x. 2x2 + x 3x – 2 6x3 – x2 – 5x + 4 Multiply: x(3x – 2) = 3x2 – 2x. 6x3 – 4x2 Subtract 3x2 – 2x from 3x2 – 5x and bring down 4. 3x2 – 5x 3x2 – 2x -3x + 4 Text Example Divide 4 – 5x – x2 + 6x3 by 3x – 2.
Solution Now we divide –3x by 3x to obtain –1, multiply –1 and the divisor, and subtract. Multiply. Divide: -3x/3x = -1. 2x2 + x – 1 3x – 2 6x3 – x2 – 5x + 4 6x3 – 4x2 3x2 – 5x 3x2 – 2x -3x + 4 Multiply: -1(3x – 2) = -3x + 2. -3x + 2 Subtract -3x + 2 from -3x + 4, leaving a remainder of 2. 2 Text Example cont. Divide 4 – 5x – x2 + 6x3 by 3x – 2.
Divisor Dividend Quotient Remainder The Division Algorithm If f (x) and d(x) are polynomials, with d(x) = 0, and the degree of d(x) is less than or equal to the degree of f (x), then there exist unique polynomials q(x) and r(x) such that f (x) = d(x) • q(x) + r(x). The remainder, r(x), equals 0 or its is of degree less than the degree of d(x). If r(x) = 0, we say that d(x) divides evenly in to f (x) and that d(x) and q(x) are factors of f (x).
Example • Divide: