Download
1 / 41
410 likes | 412 Views
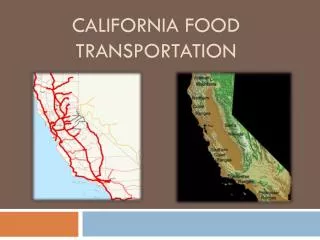
This article discusses the risks posed by the California water crisis to the state's food system and the impact on the agriculture sector. It analyzes the economic implications, the dominance of California in specialty crop agriculture, and the need for sustainability and innovation in the industry.

E N D
THE CALIFORNIA WATER CRISIS RISK TO THE CALIFORNIA FOOD SYSTEMCDFA BOARD MEETING1-21-2009 Cornelius “Corny” Gallagher Chairman California Banking Association Ag Lending Committee
U.S. FARM EQUITY ($ billions) 2007 2008 2009 2012 SOURCE (EST) USDA USDA FSE FSE • Real Estate1,912 2,052 2,084 1,826 • Total Assets2,210 2,359 2,389 • Total Debt 212 212 213 • Equity $1,998 $2,147$2,176 • Net Income$87 $91 $74 $64 • ROA3.9% 3.9%3.1%
http://aic.ucdavis.edu/publications/MOCA_Ch_5.10aPrePrint.pdfUC AG ISSUES CENTERDan Sumner, Director
Global and National Competitiveness • California is nearly 19 percent of the US Ag GDP. • California Ag is one of top ag economies in World.
Broad Economic Impacts • California farms and processing industries generate 7.3 percent of state’s private sector labor force. (This includes part-time workers.) • This accounted for 5.6% of the California state labor income in 2002. • For every $1 billion in farm sales, there are 18,100 jobs created in the state: • 10,900 in the farm sector and • 7,200 in other industries.
California farms have a significant direct effect on the state’s economy. According to the U.S. Bureau of Economic Analysis, California’s gross state product (GSP), the value added by all industries in the state, was $1,438 billion in 2003. At $21 billion (Table 5.1), agriculture (farming), forestry, fishing, hunting, and support services accounted for 1.45 percent of the California GSP.
California Agricultural Productivity, 1949-2002 Driven by water Index (1949=100) Output Index Input Index
CALIFORNIA DOMINATES U.S. SPECIALTY CROP AGRICULTURE • Almonds: 100% • Pistachios: 100% • Walnuts: 100% • Processing Tomatoes: 95% • Figs, Dates, Olives, Kiwi: 100% • Apricots: 95% • Plums/Prunes: 97% • Grapes: 87% • Vegetables: Very high percentage
Value of Commodity Type as Percentage of Total California Agriculture: 2006 Source: NASS, California Statistics
Top 5 Agricultural Producing States as Percent of Total U.S. Ag Value, 1997-2007 Source: USDA
FOCUS ON THE FUTURE DANIEL M. DOOLEY VICE PRESIDENT, UNIVERSITY OF CALIFORNIA UCD Dean’s Advisory Council April 10, 2008
Agricultural Land in California • Harvested Cropland: 8.5 million acres • 34% -- orchards and vineyards • 23% -- hay • 14% -- vegetables
11/15 fastest growing counties are major agricultural counties
Significant Cost Increases in CA Agriculture • Water • Regulatory Compliance • Fertilizer • Electricity
2009 WATER SUPPLY??POSSIBLE ZERO SURFACE DELIVERIES SOUTH OF DELTA
Provisional Draft Report 11-30- 2008 Long Term Impacts with No Groundwater increase and No Markets
Provisional Draft Report 11-30- 2008 Long Term Impacts with No Groundwater increase and No Markets
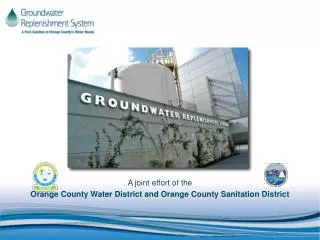
California People, Ag and the Environment Need State Water Bank to Work in 2009
Water Quality, Quantity and Mediterranean Crop ProductionRichard Howitt Cal-Med Sonoma Workshop October 25 2007Department of Agricultural and Resource Economics University of California, Davis
Yield Reduction by SalinityVanGenucten & Maas (Salinity indirectly measured as Electrical Conductivity, EC)
California Wine Community • Continued Growth – Deeply Rooted in Communities: • $45.4 billion – 40% growth from ’98-’02 • 207,550 jobs; 1,049 wineries; 4,805 growers • 14.8 million visitors • 92% of U.S. wine production • Fourth largest in the world
Top-10 California Exports, 2006 Top 5 account for 50% of total CA exports Source: Agricultural Issues Center
Global and National Competitiveness • California is losing the battle to be the low cost producer of many commodities.
California Ag Opportunities • Innovations in Sustainability and Specialty Crops. • Health benefits of ag products and parts. • Changing demographics = New products. • Food Service Chefs driving menu ideas. • Drive for local and fresh products for food service. • Environmental solutions and improvements. • It’s not waste it is …..potential new revenue. • Coordinate and collaborate research for solutions.
SUSTAINABILITY The Code is conceived around the three “E”’s
Accelerating Global Development Perspectives from the Bill & Melinda Gates Foundation September 17, 2008 Lutz Goedde Global Development