Download

1 / 14
260 likes | 1.21k Views
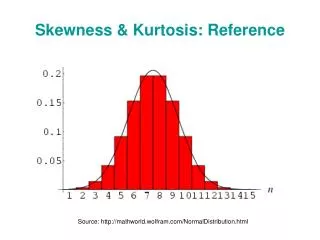
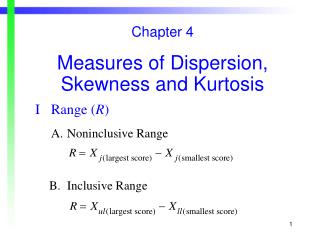
Kurtosis. Karl L. Wuensch Department of Psychology East Carolina University. What is Kurtosis?. It is the extent to which scores are dispersed away from the shoulders of a distribution The shoulders are the points where Z 2 = 1, that is, Z = 1.

E N D
Kurtosis Karl L. Wuensch Department of Psychology East Carolina University
What is Kurtosis? • It is the extent to which scores are dispersed away from the shoulders of a distribution • The shoulders are the points where Z2 = 1, that is, Z = 1. • In a symmetric distribution, the shoulders are one standard deviation on each side of the mean.
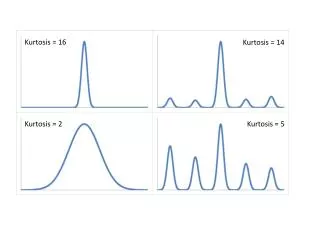
Kurtosis: From -2 to Larger Than You Can Imagine • I shall present a series of frequency distributions. • For each, the standard deviation is five, • and the mean is 10. • So the shoulders are at 5 and 15. • As we move from one distribution to the next, scores are moved further and further from the shoulders.
Kurtosis = -2.0 All of the scores are at the shoulders, none in the middle or the tails. This is a two-point binomial distribution, p = .5. I have superimposed a normal distribution so you can see where the shoulders are on a normal distribution.
Kurtosis = -1.75 Some scores have been moved from the shoulders towards the tails, others from the shoulders to the middle. The distribution now has a V shape.
Kurtosis = -1.5 The mimimum and maximum scores have been moved further into the tails or moved into the center.
Kurtosis = -1.0 The mimimum and maximum scores have been moved even further into the tails or moved into the center.
Kurtosis = 0 This distribution has the same kurtosis as a normal distribution.
Kurtosis = 1.33 This distribution has a greater kurtosis than the normal distribution – fewer scores in its shoulders than a normal distribution has.
Kurtosis = 8.0 The scores in this distribution are even further away from its shoulders. One could call this a “fat-tailed” distribution – it has an unusually large proportion of its scores way out in the tails.
You will be working with Student’s t distribution. It has kurtosis greater than that of a normal distribution, especially when its df are low. In the plot to the left, the dotted line is for the normal distribution. Notice that the t distributions have fat tails. Remember this when we start talking about the critical values for the t distribution.
Platykurtic Distributions • These are distributions with kurtosis distinctly less than zero. • They have short or absent tails. • Student, pseudonym for William Gosset, drew this platypus to help remember that platykurtic distributions have short tails.
Leptokurtic Distributions • These have high kurtosis, and thus long tails. Gosset drew these lepping (leaping) kangaroos to help him remember that leptokurtic distributions have long tails.
Additional Reading • http://core.ecu.edu/psyc/wuenschk/docs30/Skew-Kurt.docx