Download
1 / 25
260 likes | 465 Views
Modeling the impacts of land-use change on vascular plant diversity for continental Africa. Rüdiger Schaldach, Jan Göpel, Jennifer koch Center for Environmental Systems Research University Kassel, Germany. Scope. African continent Strong population growth

E N D
Modeling the impacts of land-use change on vascular plant diversity for continental Africa Rüdiger Schaldach, Jan Göpel, Jennifer koch Center for Environmental Systems Research University Kassel, Germany
Scope • African continent • Strong population growth • Increasing agricultural production • Potential threat to ecosystems and biodiversity Identification of potential conflicts and trade-offs between agricultural development and protection of biodiversity!
Study design • Adjustment of the spatial land-use model LandSHIFT to the African continent. • Analysis of agricultural area potentials and their overlap with biodiversity distribution. • Simulation of potential effects of agricultural development on biodiversity. • Trade-offs between intensification and expansion of cropland area. • Test of simple “conservation strategy” to avoid the use of areas with high biodiversity.
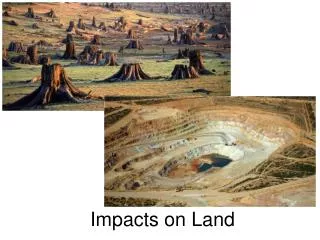
Land-use and land-cover change (Foly et al., 2005)
Drivers of land-use change (Geist and Lambin, 2002)
The Land System perspective Based on GLP (2005)
The LandSHIFT model Climate Change (Schaldach et al., 2011)
Spatial model integration Macro level (countries) • Model drivers, e.g. • Population • Crop production t+1 t Ecosystem processes Land-use change Micro level (Raster 5’)
Land-use activity „Crop cultivation“ • Terrain slope • Infrastructure • Conservation area Model drivers on macro level Input data on micro level Crop production (t) Yield increases (t) Suitability evaluation (t) Spatial allocation (t)„Multi-Objective Land Allocation“ heuristic Crop yields (t) (LPJmL) Feedback on suitability and allocation (t+1) Spatial crop distributionLand-use pattern (t)
Suitability evaluation Factor weights Evaluationfunctions Multicriteria Analysis (MCA): Suitability factors Constraints Constraints Evaluationfactors Constrainingfactors Crop yields Terrain slope … LU-transitions Conservation areas … 10
Model calibration “Objective factor weights” (Diakoulaki et al., 1995) 11
Model performance: Southern Africa Non cropland Cropland Frequency Suitability Remote Operating Characteristics (ROC) AUC = 0,635
Biomass Intactness Index (BII) The average population of vascular plants at a particular point in time relative to the population at a reference time (see Scholes & Biggs, 2005). BII • i Taxa under consideration (= 1 vascular plants) • j Ecosystem types (Diversity zones) • k Land-use activity • R Intrinsic species richness of i within ecosystem type j at the reference time (undisturbed) • A Areal extent of land-use activity k within ecosystem type j • I Species abundance relative to reference due to land-use activity k in ecosystem type j • Impact factors derived from Alkemade et al. (2009) • Undisturbed = 1; Intensive cropland = 0.1; Subsistence cropland = 0.3; Rangeland= 0.7; Urban land = 0.05 • Intrinsic species richness (R) derived from map of vascular plant diversity
Area potentials for agriculture AGRO RF Rainfed agriculture GRAZE Rangeland Suitability crops with yield > 100 kg/ha Suitability rangeland with NPP > 100 kg/ha Medium suitability RF Rainfed potential Rangeland potential Land use ≠ METRO or AGRO Land use ≠ METRO or GRAZE GIS Analyse Pflanzendiversität
Overlap with diversity zones AGRO RF Diversity zone GRAZE Area share of diversity zone
Scenario analysis Africa Plausible descriptions of how the future may unfold… scenarios until 2050 from the UNEP Global Environmental Outlook 4 Markets First Faith in markets and their advances for economy but also for social and environmental improvements. Population: 800 Mio - 1900 Mio GDP/cap: 702 $ - 3300 $ Food availability: 2460 kcal/day - 3476 kcal/day Climate: dT = 2.2 K; CO2 = 563 ppmv Sustainability First Emphasis on environmental and social concerns. Population: 800 Mio - 1400 Mio GDP/cap: 702 $ - 4300 $ Food availability: 2460 kcal/day- 4108 kcal/day Climate: dT = 1.7 K; CO2 = 478 ppmv
Land-use change experiments Scenario (GEO4) Sustainability First BIODIVConstraint Yield increases ME 1 Scenario (GEO4) Sustainability First ME 2 Scenario (GEO4) Sustainability First BIODIVConstraint ME 3 Scenario (GEO4) Sustainability First Yield increases ME 4
Land-usemap1993 Cropland: 1.662.444 km² Rangeland: 7.104.683 km²
Simulation results 2025 ME 1: Suitability First ME 2: Suitability First + BIODIV New cropland New Rangeland Cropland: 3.071.274 km² Rangeland: 7.229.874 km² Cropland: 3.546.883 km² Rangeland: 6.824.568 km²
Simulation results 2025 ME 3: Suitability First + YI ME 4: Suitability First + YI + BIODIV New cropland New Rangeland Cropland: 2.499.897 km² Rangeland: 7.384.696 km² • Cropland: 2.153.464 km² • Rangeland: 7.541.907 km²
Summary and outlook Summary • Spatially explicit LU-model LandSHIFT adapted to Africa. • The study reveals potential conflicts between agricultural development and species diversity as well as between rangeland and crop cultivation (land-use activities). • Simulation results show that intensification of agricultural management can significantly contribute to preserve biodiversity. • The selected conservation strategy has positive effects that are not fully portrayed by BII. Outlook • Regional analysis of BII will give more diverse overview. • Further simulation runs needed to identify indirect land-use changes and to learn more about competition between activities.