Download
1 / 23
230 likes | 352 Views
Seasonality of Amazon Forests Not A Sun-Sensor Illusion. Bi, Choi, Park, Knyazikhin & Myneni Speaker: Ranga B. Myneni Boston University rmyneni@bu.edu. MODIS Science Team Meeting April 29 to May 1, 2014 Columbia, MD. 1. Motivation. Morton et al. (2014):

E N D
Seasonality of Amazon Forests Not A Sun-Sensor Illusion Bi, Choi, Park, Knyazikhin & Myneni Speaker: Ranga B. Myneni Boston University rmyneni@bu.edu MODIS Science Team Meeting April 29 to May 1, 2014 Columbia, MD 1
Motivation • Morton et al. (2014): • “Here we show that the apparent green up of Amazon forests in optical remote sensing data resulted from seasonal changes in near-infrared reflectance, an artefact of variations in sun-sensor geometry” • “Previous green-up studies with MODIS EVI or LAI data did not explicitly account for changing viewing and illumination conditions” • “Amazon forests maintain consistent canopy structure and greenness during the dry season” 2
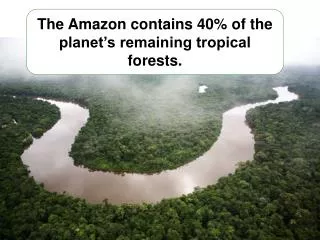
Study Area • Wet equatorial rainforests in a 1200 × 1200 km2 area in the Amazon (MODIS Tile h11v09) • Average annual rainfall over 2000 mm (TRMM data 1998 to 2012, excluding 2005 and 2010) • Number of dry months(rainfall less than 100 mm) four or less • One of two tiles studied by Morton et al. 3
MODIS LAI Analysis Terra MODIS Product from 7 Seasonal Cycles (June 2000 to March 2008, excluding June 2005 to May 2006) 4
Seasonal Course of MODIS LAI Unrelated to Sun-Sensor Geometry • LAI seasonality does not track the progression of MODIS sampling • off-principal plane in June • near-principal plane in October • off-principal plane in December • near-principal plane in March • MODIS LAI algorithm explicitly accounts for sun-sensor geometry • LAI seasonality suggests net leaf flushing during the dry season and • net leaf abscission during the long wet season 5
Seasonal Course of MODIS LAI Unrelated to Sun-Sensor Geometry • LAI seasonality unrelated to seasonal course of solar zenith angle • LAI seasonality not influenced by view zenith angle variations as they do not vary • systematically through the seasonal cycle 6
LAI Seasonal Amplitude Significant LAI Seasonal Amplitude in nearly all pixels that consistently show dry season EVI greening • LAI Amplitude = (Sep to Nov Max LAI) – (May to Jun Min LAI) • White Pixels: LAI Amplitude less than |0.66| • White and Colored Pixels: Show EVI greening in at least 4 out of 7 seasonal cycles • EVI Greening: Oct EVI greater than Jun EVI 7
Conclusions: LAI Analysis • MODIS LAI data are derived by explicitly accounting for changing viewing and illumination conditions • Therefore, LAI data are free of sun-sensor geometry effects • LAI seasonal cycle shows distinct net leaf flushing during the dry season and net leaf abscission during the wet season • Wet equatorial Amazon forests do not maintain consistent canopy structure and greenness 8
MODIS EVI Analysis Terra MODIS Product from 7 Seasonal Cycles (June 2000 to March 2008, excluding June 2005 to May 2006) Aqua MODIS Product from 4 Seasonal Cycles (June 2003 to March 2008, excluding June 2005 to May 2006) 9
Net Leaf Abscission From Dry to Wet Season (MODIS) Phase Angle: Angle between sensor view and solar directions • October EVI greater than March EVI at the same phase angle • True at all phase angles • October to March EVI decrease indicates net leaf abscission • Thus, there must be net leaf flushing during a 12-month cycle, else the result is a leaf-less forest 10
Net Leaf Abscission From Dry to Wet Season (MODIS vs. MISR) MODIS (example sampling) T-MODIS Mar T-MODIS Oct A-MODIS Oct A-MODIS Mar MISR Oct MISR Mar • MODIS and MISR data congruent • October EVI greater than March EVI • October to March EVI decrease indicates net leaf abscission 11
Net Leaf Flushing During the Dry Season • October EVI greaterthan June EVI at phase angles for which comparable observations exist • June to October EVI increase indicates net leaf flushing • Thus, there must be net leaf abscission during a 12-month cycle, else the result is infinite LAI 12
Conclusions: EVI Analysis • Dry season greening and wet season browning are not artefacts of changing sun-sensor geometry • Amazon forests do not maintainconsistent canopy structure and greenness 13
Dry Season Greening MODIS MISR (example sampling) • Evidence for dry season greening: • Terra & Aqua MODIS EVI (MAIAC) – Courtesy of A. Lyapustin • Terra MISR Near-infrared reflectance • Terra MODIS LAI (divided by 10) • These data are free of sun-sensor geometry effects • Note that MODIS and MISR sensors have opposite sampling in these months • If MODIS sampling results in artificial greening, MISR sampling should result in artificial browning • But, in both cases we see greening 15
Seasonality in Wet Equatorial Amazon Forests Figure courtesy of Xu and Saatchi • Seasonality evidenced from multiple data types, sensorsand platforms: • Terra MODIS Land Surface Temperature (LST) • Terra MODIS NBAR Near-Infrared Reflectance • QSCAT Backscatter • GOSAT Sun-Induced Chlorophyll Fluorescence • Gross Primary Production upscaled from global network of flux towers • Results from this comprehensive analysis concordant with those presented here 16
Conclusions: Multi-Sensor & Multi-Product Analysis • Various products/data from different instruments consistently show seasonality in wet equatorial Amazon forests* • *Vegetation Optical Depth (VOD) from AMSR (Courtesy of Jones, Kimball & Nemani) 17
GLAS Metrics vs. MODIS LAI: Amazon Forests • June: 2005 and 2006 • October: 2004 and 2007 • By Campaign (no averaging over years) • All GLAS data over Amazon Rainforests • LAI 1km pixels with > 3 Lidar shots • Two Metrics • WCRH (Centroid) • Apparent Reflectance (NIR) • No relationship between GLAS Metrics and MODIS LAI 19
GLAS Metrics vs. MODIS LAI: Deciduous Forests • GLAS Centroid saturates beyond LAI of 3 • GLAS Apparent NIR Reflectance insensitive to LAI 20
Relationship Between GLAS Metrics: Amazon Forests • Increase in Centroid does not correspond to increased reflectance • Increase in reflectance does not correspond to increased Centroid 21
Conclusions: GLAS Lidar Analysis • GLAS metrics not suitable for determining LAI changes of Amazon forests due to saturation • These forests maintain LAI greater than 5 during the entire seasonal cycle and exhibit a seasonal LAI variation of about 1 • The old adage “absence of evidence is not evidence of absence” applies here 22
Overall Conclusions • Wet equatorial Amazon forests do not maintain consistent structure and greenness • They exhibit a distinct light driven seasonal cycle 23