Download
1 / 53
610 likes | 961 Views
RTVue 100 The Next Generation OCT. Principles of OCT Technology. Optical Coherence Tomography (OCT) uses a principle called low coherence interferometry to derive depth information of various retinal structures

E N D
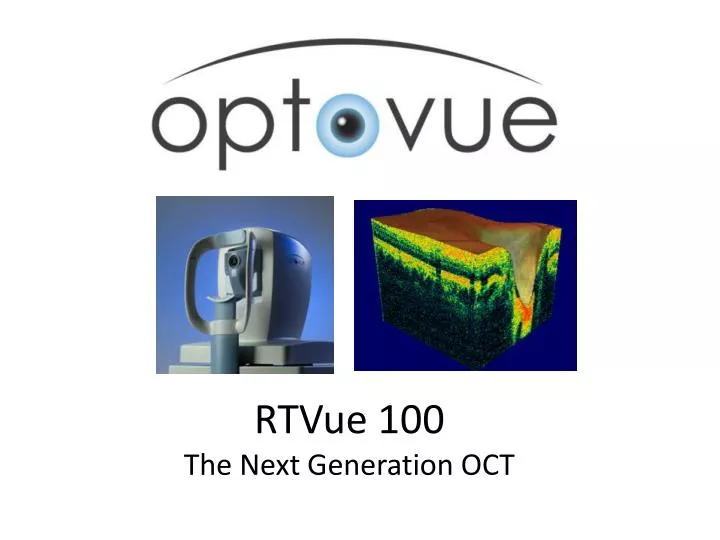
RTVue 100 The Next Generation OCT
Principles of OCT Technology • Optical Coherence Tomography (OCT) uses a principle called low coherence interferometry to derive depth information of various retinal structures • This is performed by comparing the time difference in reflected light from the retina at various depths with a reference ‘standard’ • Differences between the reflected light and the reference standard provide structural information in the form of an ‘A’ scan
Principles of OCT Technology • An A-scan is the intensity of reflected light at various retinal depths at a single retinal location • Combining many A-scans produces a B-scan Retinal Depth + + = . . . Reflectance Intensity A-scan A-scan B-scan A-scans
Fourier Domain OCT – RTVue 100 • Optical Coherence Tomography (OCT) provides cross sectional imaging of the retina • Spectrometry and Fourier Domain methods allow high speed data capture (26,000 A scans per second) • Broad-band light source provides high depth resolution (5 microns)
The Evolution of OCT Technology OptoVue RTVue 2006 Fourier domain OCT • 65 x faster • 2 x resolution 26,000 Speed (A-scans per sec) Time domain OCT Zeiss OCT 1 and 2, 1996 400 Zeiss Stratus 2002 100 16 5 10 Resolution (mm)
Evolution of Commercial OCT OCT 1 (Time Domain) 1996 Stratus OCT (Time Domain) 2002 2006 RTVue (Fourier Domain)
Time Domain OCT Reference mirror moves back and forth Lens Broadband Light Source Distance determines depth in A scan SLD Interferometer Combines light from reference with reflected light from retina Detector Creates A-scan 1 pixel at a time Scanning mirror directs SLD beam on retina Process repeated many times to create B-scan Data Acquisition Processing Final A-scan Slide courtesy of Dr. Yimin Wang, USC
Fourier Domain OCT Reference mirror stationary Broadband Light Source SLD Interferometer Combines light from reference with reflected light from retina Grating splits signal by wavelength Process repeated many times to create B-scan Spectrometer analyzes signal by wavelength FFT Entire A-scan created at a single time Spectral interferogram Fourier transform converts signal to typical A-scan Slide courtesy of Dr. Yimin Wang, USC
Time Domain OCT • Sequential • 1 pixel at a time • 1024 pixels per A-scan • 400 A scans per second • 512 A-scans in 1.28 sec • Slower than eye movements • Fourier Domain OCT • Simultaneous • Entire A-scan at once • 2048 pixels per A scan • 26,000 A scans per second • 1024 A-scans in 0.04 sec • Faster than eye movements Small blood vessels Motion artifact IS/OS Choroidal vessels 512 A-scans in 1.28 sec 1024 A-scans in 0.04 sec Higher speed, higher definition and higher signal. Slide courtesy of Dr. David Huang, USC
Fourier Domain OCT • High speed reduces eye motion artifacts present in time domain OCT • High resolution provides precise detail, allows more structures to be seen • Larger scanning areas allow data rich maps & accurate registration for change analysis • 3-D scanning improves clinical utility
Retinal Layers with RTVue & Histology Temporal Nasal Parafovea Fovea ILM NFL GCL IPL INL OPL ONL PR IS/OS RPE Choriocapillaris and choroid
RPE Elevation map reveals CNV RPE Elevation map reveals drusen & CNV
Glaucoma Analysis • RNFL Thickness Map • Neural retinal rim • Cup area • RNFL TSNIT graph at 3.45 mm circle
Measuring the ganglion cells • Inner retinal layer provides • Ganglion cell assessment: • Axons = nerve fiber layer • Cell Body = ganglion cell layer • Dendrites = inner plexiform layer Images courtesy of Dr. Ou Tan, USC
Ganglion cell layer in macula analyzed for glaucoma • Inner Retina Segmentation • Provides thickness of: • RNFL layer • Ganglion cell layer • Innerplexiform layer
Normal vs Glaucoma Cup Rim RNFL Inner Retina Macula Map Normal Glaucoma
Retina Examples Normal Rod cone dystrophy Images courtesy of Dr. Jennifer Lim, USC
Courtesy: Michael Turano, CRA Columbia University. Cystoid Macula Edema Courtesy: Michael Turano, CRA Columbia University.
Diabetic Retinopathy horizontal vertical Images courtesy of Dr. Tano, Osaka University
Central Retinal Vein Occlusion Images courtesy of Dr. Tano, Osaka University
AMD-Classic CNV horizontal vertical Images courtesy of Dr. Tano, Osaka University
Idiopathic CNV Images courtesy of Dr. Tano, Osaka University
Macula Hole horizontal vertical Images courtesy of Dr. Tano, Osaka University
Diabetic Macula Edema with Epiretinal Membrane Courtesy: Michael Turano, CRA Columbia University.
Central Serous Chorioretinopathy with PED 56 year old Female Sub-retinal fluid PED early phase FA Images courtesy of Dr. Tano, Osaka University
Stage 3 Full Thickness Macular Hole Operculum Courtesy: Michael Turano, CRA Columbia University.
Central Serous Chorioretinopathy Images courtesy of Dr. Tano, Osaka University
Epiretinal Membrane Images courtesy of Dr. Tano, Osaka University
Retinitis Pigmentosa Images courtesy of Dr. Tano, Osaka University
Vitreomacular Traction Syndrome with CME Courtesy: Michael Turano, CRA Columbia University.
Patient MB – Neovascular AMD Fundus Photograph FA Case courtesy of Dr. Nalin Mehta, Colorado Retina Center
Patient MB – Neovascular AMD Fluid accumulation CNV Case courtesy of Dr. Nalin Mehta, Colorado Retina Center
Patient MB – Neovascular AMD Full Retinal Thickness Map RPE Elevation Map Large area of abnormally thick retina from intraretinal fluid accumulation RPE elevation due to CNV Case courtesy of Dr. Nalin Mehta, Colorado Retina Center
Patient WB – Neovascular AMD • 86 year old male Fundus Photograph FA Case courtesy of Dr. Nalin Mehta, Colorado Retina Center
Patient WB – Neovascular AMD 3-D Evaluation reveals extent of CNV CNV Date: 1/10/07 Case courtesy of Dr. Nalin Mehta, Colorado Retina Center
Patient WB – Neovascular AMD Full Retinal Thickness Map RPE Elevation Map Some abnormal thickening and thinning RPE / choroid disruption identifies presence of CNV Case courtesy of Dr. Nalin Mehta, Colorado Retina Center
Patient WB – Neovascular AMD Full retinal Thickness RPE Elevation B-scan comparison 1/10/07 2/23/07 • Treatment • 2/7 – Lucentis • 2/14 – PDT Thinning of retina and improvement in RPE in response to treatment Case courtesy of Dr. Nalin Mehta, Colorado Retina Center
Patient ED – Neovascular AMD • 84 year old male, initial exam 12/13/2006 FA Full retinal thickness map RPE elevation map FA shows leakage just superior to fovea Full retinal thickness shows no thickening RPE elevation map clearly shows area of CNV superior to fovea Case courtesy of Dr. Nalin Mehta, Colorado Retina Center
Patient ED – Neovascular AMD Initial Exam: 12/13/2006 RPE/Choroid shows some reduction in height, but overall retinal thickness increases due to intra-retinal fluid accumulation Follow-up Exam: 3/20/2007 Treatment 1/17 – Macugen 3/14 - Macugen Case courtesy of Dr. Nalin Mehta, Colorado Retina Center
Patient ED – Neovascular AMD Total Retinal Thickness increases RPE elevation decreases Case courtesy of Dr. Nalin Mehta, Colorado Retina Center
Patient WW – AMD • 76 year old male. PEDs Drusen Case courtesy of Dr. Nalin Mehta, Colorado Retina Center
Patient WW – AMD Full Retinal Thickness Map RPE Elevation Map Full Retinal thickness map normal Localized elevations reveal location of PED and Drusen Case courtesy of Dr. Nalin Mehta, Colorado Retina Center
Comparison of Stratus OCT to RTVue OCT RTVue Comparison Stratus • RTVue is 65 times faster • RTVue has twice the depth resolution • Fourier Domain OCT • 26,000 A scans per second • 5 µm depth resolution • Retina Assessment • Dense Full Retinal Thickness map • RPE elevation map • 3-D macula scans • Glaucoma Assessment • RNFL map • Inner Retinal Thickness map (Ganglion cell assessment -> axon+cell body+dendrites) • Optic disc • Time Domain OCT • 400 A scans per second • 10 µm depth resolution • Retina Assessment • Sparse retinal thickness map for retina (97% interpolated) • Glaucoma Assessment • RNFL ring for glaucoma (TSNIT curve)
Comparison of Stratus OCT to RTVue OCT RTVue Glaucoma Comparison Stratus • Data Captured: 9510 A scans (pixels) • Time: 370 msec • Area covered: 4 mm diameter circle • RTVue has 97% more data • RTVue is over 5 times faster • Data Captured 256 A scans (pixels) • Time: 1.92 seconds • Area Covered: ring at 3.45 mm diameter • Provides • Cup Area • Rim Area • RNFL Map • TSNIT graph • RTVue provides comprehensive glaucoma information • Provides • TSNIT graph • Plus, RTVue has exclusive Retinal Ganglion Cell layer assessment • Data Captured: 14,810 A scans (pixels) • Time: 570 msec • Area covered: 7 x 7 mm • RTVue provides direct ganglion cell information • Inner retina analysis: • RNFL • Ganglion cell body • Inner plexiform layer • Provides • Inner Retina Map • Ganglion cell assessment in macula • No Comparison RTVue can provide 3-D imaging of the optic disc and RNFL • Data Captured: 51,712 A scans (pixels) • Time: 2 seconds • Area covered: 4 x 4 mm • RTVue provides 3 D image of optic disc and parapapillary RNFL • No Comparison • Provides • 3 D map
Comparison of Stratus OCT to RTVue OCT RTVue Retina Comparison Stratus • Data Captured: 19,496 A scans (pixels) • Time: 780 msec • Area covered: 5 x 5 mm • Data Captured 768 A scans (pixels) • Time: 1.9 seconds • Area Covered: circle 6 mm diameter • RTVue has 96% more data • RTVue is over 2.4 times faster • Provides • Sparse Retinal thickness map • 97% interpolated between lines • RTVue provides more data and a more detailed thickness map • Provides • Dense Retinal thickness map • RTVue has 3 D imaging of the macula • Data Captured: 51,7212 A scans (pixels) • Time: 2 seconds • Area covered: 4 x 4 mm • RTVue provides 3-D image of macula for a comprehensive review of B-scans over large area • No Comparison • Provides • 3 D map of the macula • Plus, RTVue has RPE elevation map for Drusen and CNV • Data Captured: 19,496 A scans (pixels) • Time: 780 msec • Area covered: 5 x 5 mm • RTVue RPE elevation map reveals location and extent of Drusen and CNV which is missed by retinal thickness maps • No Comparison • Provides • RPE Elevation map
RTVue Details • Scan Speed: 26,000 A scans per second • Depth Resolution: 5 microns • Transverse Resolution: 15 microns • Frame Rate: 256-4096 A-scans per frame • Scan Depth 2 mm – 2.3 mm • Scan length 2 mm – 12 mm • SLD wavelength: 840 +/- 10 nm • Focus Range: -15 D to +12 D • Retina scans:Glaucoma Scans • Nerve Head Map over 4 mm Diameter • Macula Map over 7 mm x 7 mm • RNFL 3.45 scan circle • 3-D Optic Disc • High res line scan • High res cross scan • Macula Map over 5 mm x 5 mm • 3-D macula scan