Download
1 / 34
340 likes | 462 Views
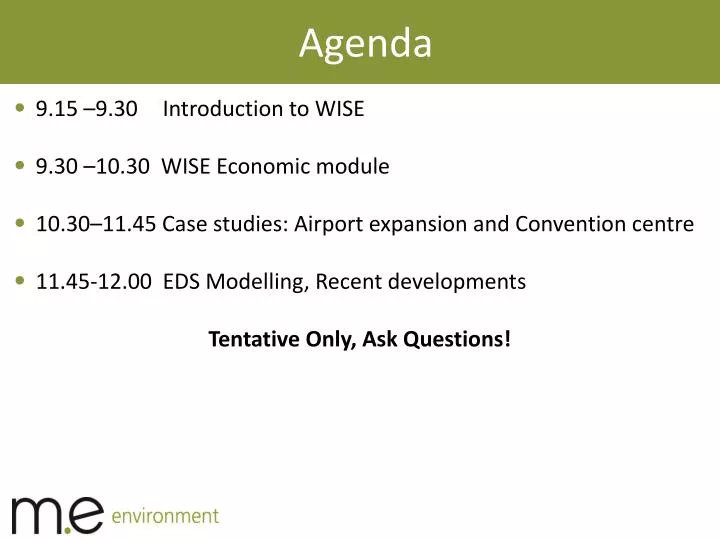
Agenda. 9.15 –9.30 Introduction to WISE 9.30 – 10.30 WISE Economic module 10.30–11.45 Case studies: Airport expansion and Convention centre 11.45-12.00 EDS Modelling, Recent developments Tentative Only, Ask Questions!.

E N D
Agenda • 9.15 –9.30 Introduction to WISE • 9.30 –10.30 WISE Economic module • 10.30–11.45 Case studies: Airport expansion and Convention centre • 11.45-12.00 EDS Modelling, Recent developments • Tentative Only, Ask Questions!
Waikato Integrated Scenarios Explorer ‘WISE’ - Economic Development Scenarios
Science Leader Dr Daniel Rutledge Creating Futures Creating Futures Developing and applyingplanning tools to make informed choices for the future Programme Leader Dr Beat Huser Dr Daniel Rutledge OBJECTIVE 2: Spatial decision support system development Dr Liz Wedderburn OBJECTIVE 1: Improved communication & deliberation tools,
Who is using ISE? • WISE was originally developed for the Waikato Region in the Creating Futures Programme (http://www.youtube.com/watch?v=RgEABCz1RrI) • ‘ISE’ models are also being developed in Auckland and Wellington under Sustainable Pathways 2, and in Christchurch under Economics of Resilient Infrastructure • Each version has slightly different sub-modules, but they may be transferred from one version to another
Heading here Environmental Cultural WELLBEING Economic Social
Stewardship Services Multi-scale Spatially-Explicit What is ISE? Goods Society Economy Labour Wastes Environment Resources Dynamic
Recognition • Diagnosis • Problem identification • Design of solutions • Exploration of solutions • Analysis • Evaluation • Selection • Authorization Policy intervention Value of a policy relevant indicator External event Policy intervention Alternative 1 Alternative 2 Alternative 3 GOAL Alternative 4 Alternative 5 Alternative 6 Policy intervention External event PAST PRESENT FUTURE Simulating policy options
How does ISE work? Supply side Demand side t-1 * Exports * Capital formation Change in final demand ($) Final demand ($) * Population – domestic consumption Reduction in output ($) Output ($) Conversion to land use demands (ha) Land use allocation Land that could not be allocated - Spatial planning- Suitability - …
Land use at time T+1 Land use & interaction weights Suitability & Transition Potentials Accessibility Zoning & = & & How does ISE work? Stochastic perturbation Transition Rule Change cells to the land use for which they have the highest transition potential until regional demandsare met Time Loop
What can ISE be used for? • Assessing the socio- economic and environmental impacts of:- • Urban issues • Spatial planning • Understanding the implications of zoning and road/port/airport infrastructure changes e.g. Ruakura inland port, SH1 • Residential, business and urban growth strategies e.g. Future proof • Economic development strategies e.g. Waikato EDS • Rural issues • Catchment issues such as N, P loadings and sediment associated with intensive farming e.g. WRISS • Land use change e.g. dairy conversion, carbon forestry
What can ISE be used for? • Policy evaluation • Quantifying trade-offs of different growth scenarios • Implications of city form questions e.g. compact versus extended MULs • Hazard impacts • Spatial Economy • Business land use and requirements by economic sector • Residential land use by household type • Infrastructure delivery • Socio-Economic Impacts • Future skills demand • Labour force projections • Identifies the mismatch between future jobs and skills
Who is using ISE? • ISE was originally developed for the Waikato Region in the Creating Futures Programme (FRST) (http://www.youtube.com/watch?v=RgEABCz1RrI) • ISE is also being developed in Auckland under Sustainable Pathways 2 programme (FRST) (Yr 4 of 6, $3.6m) • A similar model is also being constructed for Christchurch and Auckland under Economics of Resilient Infrastructure programme (MBIE) covering infrastructure outages and natural hazard events (Yr 1 of 4, $2.8m)
Economic model Economic Households (Consumers) Gross output Value added Employment (FTEs/MEC) Multipliers Households (Labour) Social Occupations Infrastructure requirements Exports (Global value chains) Ecological Capital formation Energy use Emissions (CO2, N2O, CH4) Solid waste Land use Carbon footprint
Economic interdependencies Industries driven by local demand Industries driven by intermediate demand Industries driven by International & other region demand $281m Real Estate $147m $86m Furniture Beverages $58m $99m Svc to Fnn & Ins Insurance $168m Ptrlm $91m $144m $89m $33m Cultural & Recr $377m $52m Wholesale $73m $134m $1,071m $274m $219m Business Serv Communic.Srvcs) Textile & Apparel $113m Mach & equip $112m $159m $256m $103m $84m Strct Non-metllc $173m Water supply $515m $147m $188m Air trns $30m Rub, Plst $103m $243m Basic metals $108m $69m Print, pub & rec media Transp Equipmt $59m $175m $95m $84m
Eg1: Airport expansion scenario • Expansion of airport to enable international flights(Airbus 350, 787 Dreamliner) • This would enable people to fly directly into Hamilton via several international destinations throughout the Asia Pacific region • Initially 4 to 5 flights per week (9,500 NZR departures and 14,000 overseas visitor arrivals), within 3 years 14,500 NZR departures and 19,000 overseas visitor arrivals)
Main impacts • Overseas visitors increase by 19,000 with total direct value added estimated at $12.3m per year, comprised of $2.6m hospitality, $3.9m wholesale and retail, $1.5m culture and recreational srvcs, $3.0m air transport & $1.3m road transport • International students increase from 2,000 to 4,000 then additional $14m per year • Total cost $300m, direct $80-100m investment coupled with LG/CG investment of $200m
Economic Impacts • A value added impact of between $200616m and $200618m per annum from 2016 through 2031. Or, put alternatively, 0.14% of total Waikato value added. • An average increase in direct and indirect employment of 393 jobs per year (MECs), or 7,290 job years for the period 2016 to 2031
Eg2. Airport & Convention Centre Scenario • Proposed convention centre • Build cost of $120m • Operational cost of $40m per year • Assumptions • Build is funded through FDI • All operational costs are net additional i.e. no displacement or transfer effects • Overseas tourists expenditure increases by 30% above airport expansion scenario
Economic Impacts • Direct and indirect value added contribution of $200664m based $200740m + CAGR 0.5% pa ongoing operational expenditure • Direct and indirect value added contribution of $2006100m associated with the $2006120m construction build • Approximately 1850 jobs p.a. created. Or, put alternatively, 0.7% of employment in 2025.
Modelling Economic Development • Integrated scenarios are complex to setup, requiring knowledge of all ISE modules • Economic impact should be net of the next best alternative, not net of the baseline – as there may be opportunity costs • Both costs and benefits must be modelled; many EIAs only model capital and operational expenditures – but, there are costs associated with funding, displacements, transfers
Waikato EDS and ISE • Socio-economic and environmental implications of proposed growth strategies • Definition of key sectors driving the economic development • Interpretation of what economic growth is required to meet EDS goals or targets under different scenarios • Analysis of growth scenarios using ISE over the next 20-30 years • ISE allows us to consider, in an integrated way, the economic, social (employment, skills) and environmental (land use, water, energy, emissions) tradeoffs of the EDS
Stage 1: Establish baseline EDS Analytical Process Setup ISE baseline • Stage 2: Scenario development & refinement • Develop scenarios (Client driven) • Interviews (Captains of Industry) • Capture industry growth perceptions • Additional model runs and scenario analysis Setup ISE alternatives • Stage 3: Scenario modelling & results • Implications of alternative scenarios • Implications and impacts
ISE Recent Developments • Dynamic economic model (Dec 2013) • Activity-based land use change model – AC and GW, CCC (Jun 2014) • Integration of land use, economics and transport (Sep 2013)
National / Regional spatial claims National / Regional spatial claims Zoning CA-Spatial interaction model Zoning Land suitability Cellular Automata land use model Production & Attraction Land suitability Accessibility Exogenous Land use Production & Attraction SimpleTransportation model Accessibility Distribution & Modal split Distribution & Modal split Route choice & Allocation Travel costs & Accessibility Route choice & Allocation Travel costs & Accessibility Transport module
2015 – PR66 Eg. Construction of Highway
Activity based approach • Model activity and land use separately • Land use and activities are mutually influential • More than one activity in one location
Activity based approach Land use Population