Download
1 / 16
160 likes | 299 Views
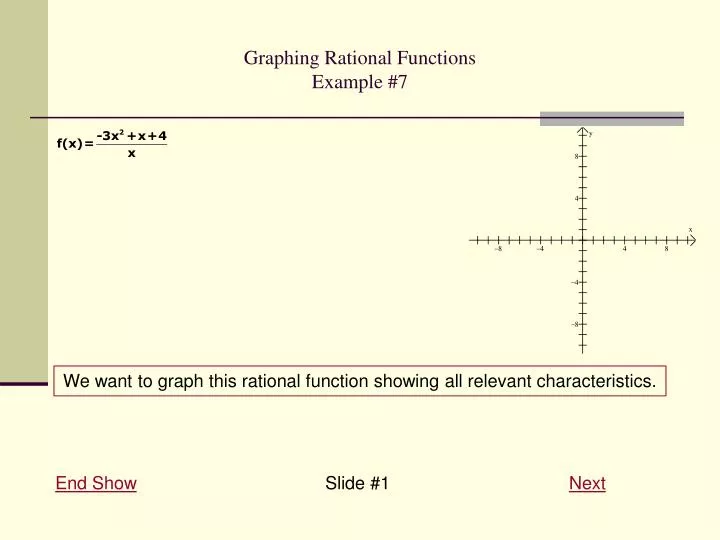
Graphing Rational Functions Example #7. We want to graph this rational function showing all relevant characteristics. End Show Slide # 1 Next. Graphing Rational Functions Example #7. First we must factor both numerator and denominator, but don’t reduce the fraction yet.

E N D
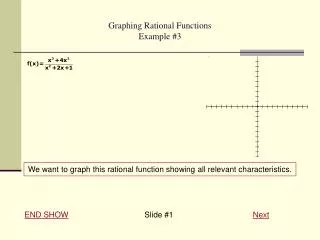
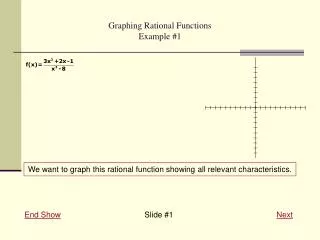
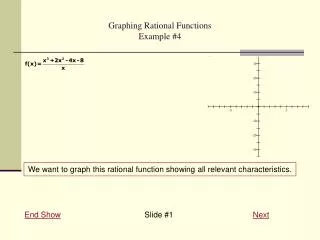
Graphing Rational FunctionsExample #7 We want to graph this rational function showing all relevant characteristics. End Show Slide #1Next
Graphing Rational FunctionsExample #7 First we must factor both numerator and denominator, but don’t reduce the fraction yet. Numerator: Factor out the negative. Then factor to 2 binomials. Denominator: Prime Previous Slide #2Next
Graphing Rational FunctionsExample #7 Note the domain restrictions, where the denominator is 0. Previous Slide #3Next
Graphing Rational FunctionsExample #7 Now reduce the fraction. In this case, there isn't a common factor. Thus, it doesn't reduce. Previous Slide #4Next
Graphing Rational FunctionsExample #7 Any places where the reducedform is undefined, the denominator is 0, forms a vertical asymptote. Remember to give the V. A. as the full equation of the line and to graph it as a dashed line. Previous Slide #5Next
Graphing Rational FunctionsExample #7 Any values of x that are not in the domain of the function but are not a V.A. form holes in the graph. In other words, any factor that reduced completely out of the denominator would create a hole in the graph where it is 0. Since this example didn't reduce, it has no holes. Previous Slide #6Next
Graphing Rational FunctionsExample #7 Next look at the degrees of both the numerator and the denominator. Because the denominator's degree,1, is exactly 1 less than the numerator's degree,2, there will be an oblique asymptote, but no horizontal asymptote. Previous Slide #7Next
Graphing Rational FunctionsExample #7 To find the O.A. we must divide out the rational expression. In this case, since the fraction didn't reduce we will use the original form. Also, since the denominator is a monomial, I'll divide each term in the numerator by the x. Previous Slide #8Next
Graphing Rational FunctionsExample #7 The O.A. will be y=(the polynomial part of the division). Previous Slide #9Next
Graphing Rational FunctionsExample #7 Now we need to find the intersections between the graph of f(x) and the O.A. The more formal way to find this is to set the function equal to the O.A., but you see this reduces to when the remainder is 0. Since, 4 is never 0, there are no intersections w/ the O.A. Previous Slide #10Next
Graphing Rational FunctionsExample #7 We find the x-intercepts by solving when the function is 0, which would be when the numerator is 0. Thus, when 3x-4=0 and x+1=0. Previous Slide #11Next
Graphing Rational FunctionsExample #7 Now find the y-intercept by plugging in 0 for x. In this case, there wouldn't be a y-intercept since the function is undefined at x=0. Previous Slide #12Next
Graphing Rational FunctionsExample #7 Plot any additional points needed. In this case we don't need any other points to determine the graph. Though, you can always plot more points if you want to. Previous Slide #13Next
Graphing Rational FunctionsExample #7 Finally draw in the curve. Let's start on the interval for x<0, the graph has to pass through the point (-1,0) and approach both asymptotes without crossing the O.A. or the x-axis again. Previous Slide #14Next
Graphing Rational FunctionsExample #7 For the interval for x>0, the graph has to pass through the point (4/3,0) and approach both asymptotes without crossing the O.A. or the x-axis again. Previous Slide #15Next
Graphing Rational FunctionsExample #7 This finishes the graph. Previous Slide #16End Show