Download

1 / 11
110 likes | 310 Views
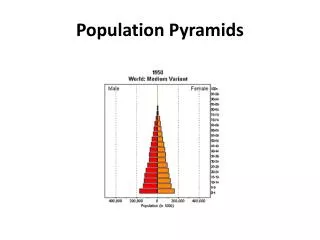
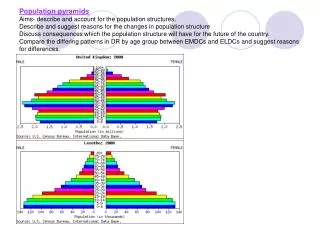
Population Pyramids. POPULATION PYRAMIDS AND THE DEMOGRAPHIC TRANSITION MODEL Population pyramid – a graph that shows the population of a country according to sex and cohort. These graphs can help predict future population trends.

E N D
POPULATION PYRAMIDS AND THE DEMOGRAPHIC TRANSITION MODEL Population pyramid – a graph that shows the population of a country according to sex and cohort. These graphs can help predict future population trends. Cohort – an age group made up of five years used in describing a population pyramid. Expansive population pyramids – countries with a high birth rate but a rapidly declining death rate. Stationary population pyramids – countries where both birth and death rates are very low. Demographic transition model – a graph outlining a country’s natural increase as a result of birth and death rates therefore showing changes in population as a result of a country’s economic development. The model is based on the changing population of Western Europe during industrialization.
STAGE 1 – pre-industrial High birth rates High death rates Moderately high population growth Primitive health and medical conditions Low life expectancy rate Very poor standard of living LLDCs
STAGE 2 – transitional High birth rate Death rate drops dramatically Improved medical conditions Largely agricultural and rural population Large families Explosive population growth LDCs
STAGE 3 – industrial Birth rate drops in response to high growth of stage 2 Death rate continues to drop slowly Improved standard of living and change in societal values Improved birth control methods Women in the labour force More urban/less rural More manufacturing and industry Smaller families Population growth is moderate and lowering; MDCs
STAGE 4 – post-industrial Low birth and death rate Good medical and health conditions Long life expectancy and high standard of living Population growth is low or negative; MDCs
Afghanistan shows a classical youth bulge. Afghanistan shows a classical youth bulge.
China had an extreme youth bulge until the 1960s, when it sharply curbed partly as an effect of the one-child policy.
Compare the population pyramid of the USA which was bulging until the 1960s and has steadily slimmed since.