Download
1 / 55
560 likes | 800 Views
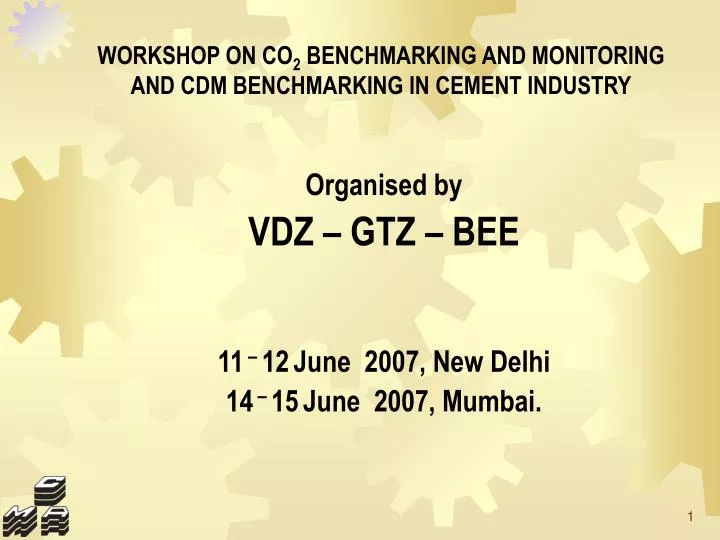
WORKSHOP ON CO 2 BENCHMARKING AND MONITORING AND CDM BENCHMARKING IN CEMENT INDUSTRY. Organised by VDZ – GTZ – BEE 11 – 12 June 2007, New Delhi 14 – 15 June 2007, Mumbai.

E N D
WORKSHOP ON CO2 BENCHMARKING AND MONITORING AND CDM BENCHMARKING IN CEMENT INDUSTRY Organised by VDZ – GTZ – BEE 11 – 12June 2007, New Delhi 14 – 15June 2007, Mumbai.
ENERGY EFFICIENCY INITIATIVES, ESTIMATION OF CO2 EMISSION AND BENCHMARKING ENERGY AND ENVIRONMENTAL PERFORMANCE IN INDIAN CEMENT INDUSTRY Dr. S.P. Ghosh - CMA
Top 5 Cement Producing Countries Cement Production
OUR CEMENT INDUSTRY – STATUS 12-06 • International Ranking : 2nd • Installed Capacity* : 180 mn.t • Production* : 162 mn.t • No. of Plants : Large : 130 • Mini** : 206 - Rotary : 13 • - VSK : 193 • *Projected, 2006-07 • **AIMCMA - 2006 Source: CMA
PLANTS WITH CAPACITY OF ONE MILLION TONNES AND ABOVE
CHANGING PROCESS PROFILE OF INDIAN CEMENT INDUSTRY
CEMENT VARIETIES – PRODUCTION IN 2006-07 • Production %age of • (Mil.Tonnes) Total • Ordinary Portland Cement : 48.64 31.25% • Portland Pozzolana Cement : 93.52 60.08% • Portland Blast Furnace Slag : 12.84 8.25% • Others and Special Cements : 0.65 0.42% Total: 155.65 100.00%
KEY PERFORMANCE INDICATORS * Report of the Working Group on Cement Industry – X Five Year Plan (2002-03 to 2007-08) # Report of the Working Group on Cement Industry – XI Five Year Plan (2007-08 to 2011-12) Figures in ( ) Pertain to Japanese Cement Industry
QUANTUM OF ENERGY INPUTS TO INDIAN CEMENT INDUSTRY COAL CONSUMPTION : 22 MILLION T/YEAR POWER CONSUMPTION : 14 BILLION UNITS/YEAR TOTAL ENERGY BILL : RS 95 BILLION kWH/ YR CAPTIVE POWER GENERATION DIESEL : 1108 MW THERMAL : 716 MW WIND ENERGY : 80 MW TOTAL : 1904 MW
ENERGY CONSUMPTION PROFILE (DRY PROCESS PLANTS - WTD. AVG.) THERMAL ENERGY KCAL/KG CL. BEST IN INDIA BEST IN WORLD ELECTRICAL ENERGY KWH/T CEMENT
Process wise Cement Energy Consumption Pattern in India 2006 Sources : CMA, NCB * Best Achieved
CMA Benchmarking Exercise • Improve productivity • Reduce Energy Consumption • Increase profitability
CMA Benchmarking Exercise Contd.. • Compares your plant with similar others • Benchmark today includes 75 plants on quarterly basis and 100 plants on annual basis comprising • 130 crushers • 116 raw mills • 125 coal mills • 112 kilns • 209 cement kilns
CMA Benchmarking Exercise Contd.. • It regularly tracks and reports to participating plants their individual performance with respect to the “Average” and “ Best” Performer in respective affinity groups. • An affinity Group for any particular major equipment or auxiliary includes the same type of equipment, providing thereby a comparison between the likes only.
AFFINITY GROUPDEFINITIONS FOR DIFFERENT EQUIPMENTS • Classification Codes • Crushers • Jaw CR1 • Roll CR2 • Impact CR3 • Hammer CR4 • Hammer Impactor CR5 • Hybrid CR6 • Others CR7 • Raw Mills • Ball Mill RM1 • Ball Mill with high efficiency classifier RM2 • Hybrid Mills (Roll Press + Ball Mill) RM3 • Vertical Roller Mill RM4
AFFINITY GROUPDEFINITIONS FOR DIFFERENT EQUIPMENTS • Classification Codes • Coal Mills • Ball Mill upto 30 tph CLM1 • Ball Mill with 30 + tph CLM2 • VRM CLM3 • Other Systems CLM4 • Kilns • Wet Process upto, 1000 TPD KL1 • Semi Dry Process, upto 1000 TPD KL2 • Long Dry Kilns with • Upto, 1000 TPD KL3 • 1000 – 1500 TPD KL4 • 1500 – 2000 TPD KL5
AFFINITY GROUPDEFINITIONS FOR DIFFERENT EQUIPMENTS Classification Codes Dry Kilns with 2000 – 2500 TPD, Pre-Heater KL6 2000 – 2500 TPD, With PH and PC KL7 2500 – 3000 TPD, With 4 Stage PH & PC KL8 2500 – 3000 TPD, With 5 – 6 Stage PH & PC KL9 3000 – 3500 TPD, With 4 Stage PH & PC KL10 3000 – 3500 TPD, With 5 – 6 Stage PH & PC KL11 3500 – 4500 TPD KL 12 4500 – 6000 TPD KL13 6000 – 8000 TPD KL14
AFFINITY GROUPDEFINITIONS FOR DIFFERENT EQUIPMENTS • Classification Codes • Cement Mills • Ball Mill upto 30 TPH CM1 • Ball Mill upto 30 – 50 TPH CM2 • Ball Mill upto 50 – 100 TPH CM3 • Ball Mill upto 100 – 150 TPH CM4 • Ball Mill upto 150 – 200 TPH CM5 • Ball Mill upto 200 + TPH CM6 • Ball Mill with High Efficiency Classifier CM7 • Vertical Roller Mill CM8 • Hybrid (Roll Press + Ball Mill) CM9
Vasavadatta Cement - Sedam Kanoria Cement - Bagalkot Dalmia Cement (Bharat) Ltd.-Dalmiapuram Mangalam Cement Unit-I Morak Birla Cement Works - Chittorgarh Mangalam Cement Unit-II Morak Chittor Cement Works - Chittorgarh Century Cement - Baikunth Binani Cement Ltd. - Binanigram Chettinad Cement (Puliyur Cement Works) Chettinad Cement (Karikkali Cement Works) Mysore Cement Ltd. - Ammasandra Zuari Cement - Yerranguntla India Cement - Sankarnagar Guj Ambuja – Himachal (Ambuja Group) Aditya Cement – Adityapuram (Grasim Group) Rajashree Cement – Malkhed (Grasim Group) Guj Ambuja - Bhatinda* (Ambuja Group) Guj Ambuja - Ropar* (Ambuja Group) Grasim Cement – South (Grasim Group) Guj Ambuja - Rabriyawas (Ambuja Group) Grasim Cement- Raipur (Grasim Group) Maratha Cement - Chandrapur (Ambuja Group) Birla Super - Solapur* (Grasim Group) Gujarat Ambuja - Eastern (Ambuja Group) Birla Plus - Bhatinda* (Grasim Group) Shree Digvijay Cement – Sikka (Grasim Group) Ambuja Cement-Kodinar (Ambuja Group) Vikram Cement – Khor (Grasim Group) Gajambuja Cement-Kodinar (Ambuja Group) Madras Cement -Alathiyur Gujarat Sidhee Cement – Veraval Shree Cement Ltd., Unit – I (Shree) ACC Mancherial (ACC) Shree Cement Ltd., Unit – II (Shree) KCP Macherla CCI – Tandur Manikgarh Cement - Gadchandur PARTICIPANTS CEMENT PLANTS
Maihar Cement Unit-I Saralanagar Tamil Nadu CementCorp.-Ariyalur Maihar Cement Unit-II Saralanagar Damodhar Cement & Slag Ltd.-Madhukunda* Birla Vikas Cement - Satna India Cement - Sankari Satna Cement Works - Satna Birla Corp. Ltd. - Raebareli* Lakshmi Cement - Banas India Cements Ltd. - Dalavoi Kesoram Cement - Basant Nagar India Cement – Vishnupuram Ambuja Cement Eastern - Sankrail* (Ambuja Group) ACC - Kymore Cement Work (ACC) Shriram Cement Works - Kota Indorama Cement Ltd.* Madras Cement-Ramasamyraja Nagar Ultra tech CemCo – A.P Cement Works ACC – Tikaria Cement Works* (ACC) Diamond Cements - Jhansi* Orient Cement - Devapur ACC – Chanda Cement Works (ACC) ACC – Madukkarai Cement Works(ACC) Priyadarshini Cement Ltd.-Nalgonda ACC – Chaibasa Cement Works (AC) Birla Corp-Durgapur Cement Works* J.K.Cement- Nimbahera Narmada Cement Co. Ratnagiri J.K.Cement- Mangrol Narmada Cement Company Magdalla Ultratech Jharasguda ACC - Gagal UltraTech Cement Arakkonam Narmada Cement Co. Ltd. – Jafarabad UltraTech UltraTech Hirmi UltraTech CemCo- Awarpur OCL India Ltd.-Rajgangpur Gujrat Cement Works
Indicators which are being used in affinity group report • Electric energy consumption – Crushing (Kwh per ton of limestone) • Electric energy consumption – Raw Mill (Kwh per ton of raw mix) • Electric energy consumption – Kiln (Kwh per ton of clinker) • Electric energy consumption – Cement Mill (Kwh per ton of OPC 43 equivalent) • 5) Electric energy consumption – Coal Mill (Kwh per ton of coal) • 6) Thermal Energy consumption (burning) – Kiln & Cooler (Kcal per kg of clinker)
Indicators which are being used in Environment report • Conventional Air Pollution • SPM Released -- Cement Mill (mg/Nm3) • SPM Released -- Clinker Cooler (mg/Nm3) • SPM Released -- Coal Mill (mg/Nm3) • SPM Released -- Kiln (mg/Nm3) • Ambient Quality • SPM Concentration-Average Value (mg/Nm3)
TEXT BASED REPORTS SAMPLE 1) QUATERLY PERFORMANCE REPORT – AFFINITY WISE Energy Consumption – AFFINITY WISE PLANT XX QUARTER II YEAR 2006 Equipment Affinity Rating of Equipment Affinity Group Values Group Performance Your Avg Best Coeff of ELECTRICAL ENERGY (Kwh per ton of material) Value Variation ( % ) • 1 CRUSHER CR3 AVERAGE 1.34 1.36 0.43 32.70 • 2 RAW MILL - I RM1 ABOVE AVERAGE 17.38 21.16 8.50 17.69 • 3 RAW MILL - II RM1 ABOVE AVERAGE 17.06 21.16 8.50 17.69 • 4 KILN - I KL4 AVERAGE 27.73 28.43 20.63 13.77 • 5 KILN - II KL4 AVERAGE 27.34 28.43 20.63 13.77 • 6 CEMENT MILL – I CM2 ABOVE AVERAGE 28.18 32.33 22.88 12.38 • 7 CEMENT MILL – II CM2 ABOVE AVERAGE 28.00 32.33 22.88 12.38 • 8 CEMENT MILL – III CM2 BELOW AVERAGE 40.02 32.33 22.88 12.38 • THERMAL ENERGY FOR BURNING(KCal per kg of clinker) • 9 KILN - I KL4 AVERAGE 820.00 828.54 756.00 5.78 • 10 KILN - II KL4 AVERAGE 820.00 828.54 756.00 5.78
2) QUATERLY PERFORMANCE REPORT – PLANT LEVEL QUATERLY REPORT FOR PERFORMANCE INDICATORS PLANT XX QUARTER YY YEAR YYYY Description YourYour Plant Avg of Best Performance Value Group Values Conventional Air Pollution 1 SPM Released -- Cement Mill (mg/Nm3) BELOW AVERAGE 71.00 62.36 11.69 2 SPM Released -- Clinker Cooler (mg/Nm3) BELOW AVERAGE 74.00 67.90 18.30 3 SPM Released -- Coal Mill (mg/Nm3) AVERAGE 61.00 58.14 17.20 4 SPM Released -- Kiln (mg/Nm3) ABOVE AVERAGE 40.00 76.77 14.00 Ambient Quality 5 SPM Concentration-Average Value (mg/Nm3) ABOVE AVERAGE 0.11 0.18 0.06
GRAPHICAL REPORTS 1.) PERFORMANCE OF CEMENT MILL IN ITS AFFINITY GROUP AFFINITY GROUP DESCRIPTION : BALL MILL, 50-100 TPH (CM3) Electrical Energy in Kwh/ton of OPC43 equ.
GRAPHICAL REPORTS 2.) PERFORMANCE OF CEMENT MILL OF A PLANT OVER FOUR QUARTERS
GRAPHICAL REPORTS 4.) PERFORMANCE OF ALL THE CEMENT MILL OF A PLANT OVER FOUR QUARTERS.
GRAPHICAL REPORTS 1) PERFORMANCE OF CEMENT MILL WITH THE AVG & BEST OF ITS PEER GROUP OVER ANY TIME PERIOD.
2) COMPARITIVE ANALYSIS OF EQUIPMENT (CEMENT MILL) ACTUAL INDIVIDUAL PLANTS BEST AVERAGE
PROPOSED ENERGY CONSUMPTION NORMS SUGGESTED BY CMA & NCB Item SystemProposed Norms Thermal Energy 1. Wet Process < 1400 (Unit K.Cal/Kg. 2. Semi-Dry Process Clinker measures 3. Dry Process Kiln < 1000 TPD< 1000 As NCV) 4. Dry Process, Kiln 1000 to 2000 TPD Capacity< 875 5. Kiln with 2000 to 3500 TPD Capacity on Commissioning a) Plants Commissioned before 1989 < 850 b) Plants Commissioned after 1989, or Old Plants with Major Modification after 1989 – initial Capacity less than 3500 TPD < 820 6. a) Kiln above 3500 TPD Capacity – Commissioned Pre 2000 < 800 b) Kiln above 3500 TPD Capacity – Commissioned Post 2000 < 770 All Capacities mean Original Installed Capacity.
PROPOSED ENERGY CONSUMPTION NORMS SUGGESTED BY CMA & NCB Item System Power1. Integrated Plants (Kwh/Tonne Cement) a) OPC - 43< 110 b) OPC – 53 < 112 c) PPC < 100 d) PSC < 108 2. Grinding Unit a) OPC - 43< 110 b) OPC – 53 < 112 c) PPC < 100 d) PSC < 108 Power Consumption for Pozzolana Cement (PPC) and Slag Cement (PSC) depends upon the percentage of fly ash or slag used and varies widely for the same plant. Grinding units should not have separate Norms. The energy (power) consumption should be linked to that of the sources clinker. The power consumption values for each Grinding unit should be computed on the basis of power consumption up to clinkerisation of the mother unit from which the clinker is sourced, plus the value for cement grinding, and be equated with the power consumption for the integrated plant.
Proposal to BEE for Energy Conservation NormsVoluntary Reduction for Power Consumption • Annual Reduction to be monitored only at the end of the block period. • Block period may be considered as 3 years. • Base Year – 2006-2007 – Figures may be considered. • Hence, Terminal Year for the Block period = 2009-2010.
GHG Emission from Cement Manufacture • Cement manufactured generates one major GHG – CO2 • One tonne of cement produces 0.6 to 1.0 tonne of CO2 • The sources of CO2 emission are • Calcination : 45 - 50% • Fuel Combustion : 40 - 45% • Power used/ generation : 10 - 20%
ESTIMATION OF CO2 EMISSION OVER DECADES - INDIAN CEMENT INDUSTRY YEARIPCCCMANCL 1990 20933 20933 20851 1994 29510 29461 29305 2000 47317 46742 46774 IPCC :interGov-l Panel on Climate Change CMA :Cement Manuf. Association,India NCL :National Chemical Laboratories,India
SIGNIFICANT GHG EMISSION REDUCTION • YEARCEMENT PRODNGHG EMISSIONRATIO • Cement: GHG • 1990 44.87 mln.t 53.84 mln.t 1.20 • 1996 64.54 mln. t 77.02 mln. t 1.19 • 2000 94.21 mln. t 91.82 mln. t 0.97 • 117.45 mln. t 101.55 mln. t 0.86 • 2005 142.67 mln. t 119.84 mln. t 0.84 • 2006 158.78 mln. t 131.78 mln. t 0.83
FUTURE TARGETS FOR GHG REDUCTION Area of Future Use Likely GHG Reduction Improvement% (2015) (%) Blended Cements 75-80 22-24 CNG as Fuel 20 8-9 Waste Derived Fuel 20 8-9 Non-Conventl Energy 8 2-3 (Wind,Hydro) Energy Efficient 10 8-10 Plant/Machinery ____________________________ TOTAL 48-55
Carbon Sequestration About20 millions TreesPlanted in last 2 decades Around Plants - Carbon Sink Mined out areas converted into lakes. SIBERIAN Birds certify Our eco-friendliness.
GHG PROTOCOL: SOME BACKGROUND • Convened in 1998 by WRI and WBCSD • Mission: to develop international GHG accounting & reporting standards for business through an inclusive & transparent multi-stakeholder process • Two modules: GHG Protocol Corporate Accounting and Reporting Standard (Corporate Standard) and GHG Protocol for Project Accounting (Project Protocol)
BENEFITS OF A COMMON STANDARDS • Simplify measurement & reporting • Harmonization across international borders & different initiatives • Improve comparability & credibility • Minimize the cost of developing a GHG inventory • Establish a common foundation for GHG markets.
CUSTOMIZATION OF INVENTORY TOOLS: INDIA – INDUSTRY FRIENDLY & CUSTOMIZED FOR INDIAN CONDITIONS • Goal: Improved consistency & accuracy in estimation of emissions *Develop sector-specific Emission Quantification Tool: — User-friendly, streamlined — Incorporates needs & objectives of key stakeholders — Reflects Indian operating conditions, developments and testing in India by Indian Industry. • Start with internationally developed tool and methodologies: GHG Protocol (WRI/WBCSD) *Add India-specific fuels, emissions factors, generation mix data * Add conventional air pollutants • Cement Sector Tool Completed • Power Sector Tool Under Development
CORPORATE GHG MANAGEMENT: STEP-BY-STEP • Secure Management support • Establish a Team • Prepare a Budget • Define Inventory Boundary • Determine Sources of Emissions • Factor in Emissions from Leased Assets • Design Efficient Data Management System • Select a Base Year • Obtain appropriate Data, ensure Data Quality • Apply Calculation Tool • Guard against Calculation Errors • Identify Emission Reduction opportunities • Decide on Target Type • Decide on Target Level • Implement Emission Reduction Activities • Publicly Report Inventory.
IDENTIFICATION OF GHG EMISSION SOURCES • All forms of stationary combustion sources: kilns, precalcinators, captive power plant (DG etc), driers etc. • Process related emissions: GHG emissions resulting due to process operations i.e. emission of CO2 due to calcination of raw materials. • Emissions from mobile sources: company owned vehicles, locos, quarry equipment etc. • Indirect emissions (import and export of electricity) • For accounting GHG emissions at plant level, all emissions to be classified as scope (1/2/3).