Download
1 / 75
750 likes | 886 Views
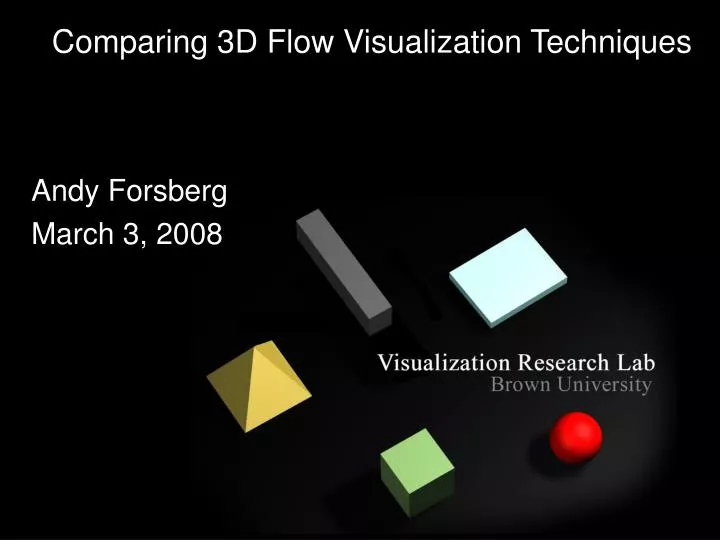
Comparing 3D Flow Visualization Techniques. Andy Forsberg March 3, 2008. Roadmap. Motivation Study Design Preliminary Results. 3D Flow overview. Weather map = 2D (mostly) We’re looking at 3D flows… When is 3D important?. Of course all this is 3D….

E N D
Comparing 3D Flow Visualization Techniques Andy Forsberg March 3, 2008
Roadmap Motivation Study Design Preliminary Results
3D Flow overview Weather map = 2D (mostly) We’re looking at 3D flows… When is 3D important?
Of course all this is 3D… how do the available techniques compare for understanding the flow data?
Working Environment User study room..
Motivation How do various visualization methods compare?
Data & Task Selection What do flow scientists need to see?
Motivation Which established visualization techniques work well? How do they compare?
Characterizing 3D Flow Visualization Techniques • Modeled after 2D study Laidlaw et al, “Comparing 2D Vector FieldVisualization Methods: A User Study”,IEEE CG&A, Jan/Feb 2005
Characterizing 3D Flow Vis. Techs. • We want to characterize the relative value • potentially a huge number of techniques • working initially with some traditional, some contemporary techniques
Current Design • Four tasks • Methods • Datasets • Working environments (desktop, fishtank, wall, Cave)
Definition: Critical Point [talk to it.. No slide] • Why is it significant? • Something is happening there.. E.g., hands coming together • What is it? • Show 9 types of critical points (illustrations…) • Sometimes CPs are indirectly what fluids people are studying..
Four tasks [separate to 4 slides, pictures will help] • Modeled after Laidlaw et al. 2D study • “Is this a critical point?”
Four tasks (cont.) • “What type of critical point is this?”
Four tasks (cont.) • “What type of critical point is this?” • Sadle,
Four tasks (cont.) • “What type of criticalpoint is this?” • Source • Saddle • Sink • Spiral {source, saddle, sink} • (numerical error )
Four tasks (cont.) • “Does point A integrate to point B?” • “Is this point in swirling flow?”
Visualization methods • Streamtubes • Illuminated streamlines • Isosurfaces of pressure • Particle Flurries
Datasets • Goal: create vector fields that have 2-8 CP’s in them.. • Jian extended 2D generation method to 3D • Can get n critical points per dataset • Have hundreds of samples we can use • No surface interaction
Working environments • Desktop initially • Desktop vs Tiled Wall vs Cave
Next-generation Cave • Do we need a Cave with pixel qualities like a conventional desktop? Is that too much? Not enough? • How good is the bright, 30 dpi tiled-wall? • Add Cave, tiledwall, desktop to user study
Preliminary Results • Ran ‘n’ subjects • Graph of performance, % correct answers, subjective responses
Questions for audience • Critique/comments? • What would make it stronger as a research project (later paper)? • What other vis methods should we be using?
Hypothesis • The speed and completeness of 3D flow understanding is proportional to one’s degree of presence with the data
Immersion vs. Presence • Immersion refers to the objective level of sensory fidelity a VR system provides • Presence refers to a user’s subjective psychological response to a VR system • e.g., sense of sharing space with the data. I am there. Data is close by and I have a strong appreciation of its spatial representation. • Strong presence with data -> best chance for understanding it This is a developing idea..
Immersion vs. Presence (cont.) • Mel Slater • “whole body engagement with something life-sized is critical aspect”
Hypothesis (cont.) • More informally.. as complexity increases, the more you feel like you actively share space with the data, the better you will understand it– i.e., the better you can handle the complexity. • “the data” is numbers.. • visualization is intermediary (data ► vis ► perception) • “infinite” number of visualizations, which work best?
What kinds of data should be tested? What tasks? • blood flow • birds and bats • cars and planes • more?
Finding good data and tasks • Q: Who needs to better understand 3D flow? • Q: Who regularly looks at 3D flow? • Q: Would more immersion/presence helpbetter understand it? • Fred Brooks, “Production Applications”