Download
1 / 16
160 likes | 295 Views
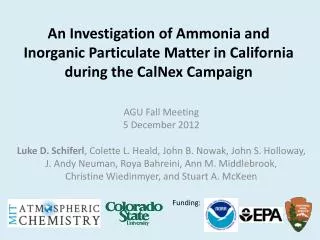
Determination of atmospheric temperature, water vapor, and heating rates from mid- and far- infrared hyperspectral measurements. AGU Fall Meeting, Wednesday, December 12, 2007 GC34A-02 D.R. Feldman (Caltech); K.N. Liou (UCLA); Y.L. Yung (Caltech);

E N D
Determination of atmospheric temperature, water vapor, and heating rates from mid- and far- infrared hyperspectral measurements AGU Fall Meeting, Wednesday, December 12, 2007 GC34A-02 D.R. Feldman (Caltech); K.N. Liou (UCLA); Y.L. Yung (Caltech); D. G. Johnson (LaRC); M. L. Mlynczak (LaRC)
Presentation Outline • Motivation for studying the far-infrared • FIRST instrument description • Sensitivity tests of mid-IR vs far-IR capabilities • Clear-sky • Cloudy-sky • Multi-instrument data comparison • Climate • Conclusions • Outline
Current EOS A-Train measure 3.4 to 15 μm, don’t measure 15-100 μm IRIS-D measured to 25 μm in 1970 Far-IR, through H2O rotational band, affects OLR, tropospheric cooling rates Far-IR processes inferred from other spectral regions Mid-IR, Microwave, Vis/NIR Interaction between UT H2O and cirrus clouds requires knowledge of both Currently inferred from measurements in other spectral regions The Far-Infrared Frontier No spectral measurements to the right of line Figures derived from Mlynczak et al, SPIE, 2002 • Motivation
FIRST: Far Infrared Spectroscopy of the Troposphere AIRS AIRS • FTS w/ 0.6 cm-1 unapodized resolution, ±0.8 cm scan length • Multilayer beamsplitter • Germanium on polypropylene • Good performance over broad spectral ranges in the far-infrared • 5-200 μm (50 – 2000 cm-1) spectral range • NeDT goal ~0.2 K (10-60 μm), ~0.5 K (60-100 μm) • 10 km IFOV, 10 multiplexed detectors • Cooling • Spectrometer LN2 cooled • Detectors liquid He cooled • Scan time: 1.4-8.5 sec • Balloon-borne & ground-based observations FIRST • FIRST instrument
Retrieval Sensitivity TestFlow Chart Random Perturbations Model Atmosphere A priori Atmospheric State) RTM RTM + Noise A priori uncertainty A priori spectrum Synthetic Measurement T(z) H2O(z) O3(z) CWC(z) CER(z) Retrieval algorithm Analyze retrieved state, spectra, and associated statistics • Sensitivity tests
Clear-Sky Retrieval Test • AIRS and FIRST T(z) retrievals comparable. • FIRST better than AIRS in H2O(z) retrievals 200-300 mbar. • Residual signal in far IR seen 100-200 cm-1 → low NeDT critical • Sensitivity tests
Clear-sky Heating Rates Tropical Conditions Sub-Artic Winter Conditions • Spectra provide information about fluxes/heating rates • Error propagation (Taylor et al, 1994; Feldman et al, In Review) can be used • Heating rate error for scenes with clouds generally higher due to lack of vertical cloud information • Heating Rates
Extrapolating Far-IR with Clouds • Retrieval of T(z), H2O(z), CWC(z), CER(z) difficult with AIRS spectra • Use AIRS channels to extrapolate far-IR channels? • Depends on cloud conditions, T(Z), H2O(z) • Low BT channels from 6.3 μm band ≈ low BT channels in far-IR • High BT channels scale from mid- to far-IR • For tropics, channels with BT 250-270 K (emitting ~ 5-8 km) are complicated • Clouds
Test Flight on September 18, 2006:Ft, Sumner NM AQUA MODIS L1B RGB Image FIRST Balloon AIRS Footprints CloudSat/CALIPSO Track • Test flight
CloudSat/CALIPSO signals • CloudSat and CALIPSO near collocation • No signal from CloudSat • CALIPSO signal consistent with FIRST residual • Test flight
FIRST and AIRS Cloud Signatures • Instrument collocation • FIRST balloon-borne spectra • AIRS • MODIS • Residuals are consistent with clouds ~ 5 km, De ~ 60 μm Cloud Detected ! • Test flight
Climate Model Considerations • Climate models produce fields that specify mid- & far-IR spectra. • Multi-moment statistical comparisons of measured spectra and spectra produced by models avoid subtle biases from data processing algorithms • Spectral and atmospheric state spaces should be considered jointly. • Far-IR climate model analysis requires more far-IR data • Extrapolation of far-IR should retain some physical basis and be verified with hyperspectral measurements. • Agreement with CERES data is only partial verification and presents a non-unique checksum • Future work is required to assess how spectra impart information towards climate model processes. • Model evaluation
Conclusions • AIRS measures mid-IR, but far-IR is not covered A-Train spectrometers. • FIRST provides thorough description of far-IR but limited spectra are available. • FIRST clear-sky T retrievals comparable, improved UT H2O retrieval relative to AIRS • Implied cooling rate information difference is small . • Extrapolating far-IR channels good for Tb ~ 220 K, ok for Tb ~ 300 K, difficult for Tb ~250-270 K. • Multi-instrument analysis with A-Train facilitates comprehensive understanding of FIRST test flight spectra. • AIRS mid-IR spectra can validate climate models, but far-IR should not be neglected. • Conclusions
Acknowledgements • NASA Earth Systems Science Fellowship, grant number NNG05GP90H. • Yuk Yung Radiation Group: Jack Margolis, Vijay Natraj, King-Fai Li, & Kuai Le • George Aumann and Duane Waliser from JPL • Xianglei Huang from U. Michigan and Yi Huang from Princeton • AIRS, CloudSat, and CALIPSO Data Processing Teams • Thank you for your time
Cloud Radiative Effect (CRE) • CRE = TOA clear broadband flux – TOA broadband flux • CERES provides collocated measurements of CRE from broadband radiometers • Most CERES products contain multiple data-streams • AIRS L3 CRE lower than CERES CRE • Other A-Train sets (CloudSat/CALIPSO) can arbitrate difference • Clouds
Towards CLARREO • NRC Decadal Survey recommended CLARREO for • Radiance calibration • Climate monitoring • CLARREO specified to cover 200 – 2000 cm-1 with < 2 cm-1 resolution • NIST traceability requirement • Prototyped far-IR instruments provide a science and engineering test-bed for next generation of satellite instruments • Further orbital simulations required to test how mid-IR state space uncertainties appear as far-IR spectral residuals • More integrated A-train analyses w.r.t. Far-IR warranted • Larger Far-IR dataset analysis needed to demonstrate utility of long wavelength measurements for climate monitoring • Don’t forget about 50-200 cm-1 (200-50 μm). • Future directions