Download
1 / 4
40 likes | 199 Views
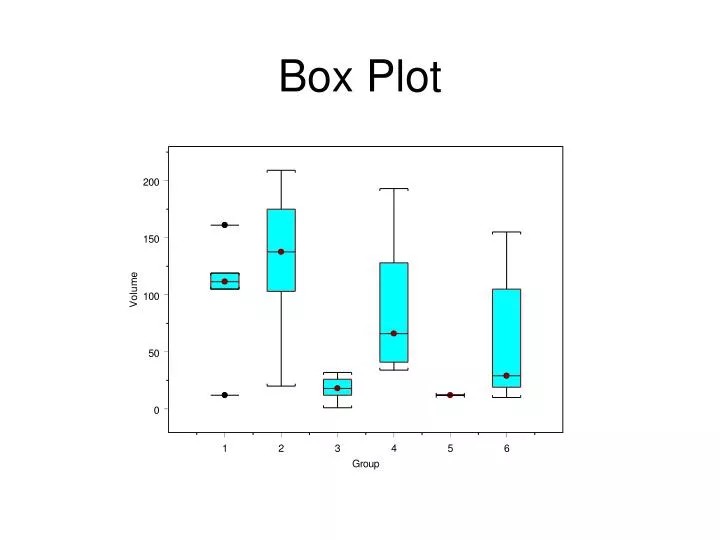
Box Plot. F-Test Results. *** Analysis of Variance Model *** Short Output: Call: aov(formula = Volume ~ Group, data = SDF9, na.action = na.exclude) Terms: Group Residuals Sum of Squares 12888.6 146259.0 Deg. of Freedom 1 39

E N D
F-Test Results • *** Analysis of Variance Model *** • Short Output: • Call: • aov(formula = Volume ~ Group, data = SDF9, na.action = na.exclude) • Terms: • Group Residuals • Sum of Squares 12888.6 146259.0 • Deg. of Freedom 1 39 • Residual standard error: 61.23913 • Estimated effects may be unbalanced • Df Sum of Sq Mean Sq F Value Pr(F) • Group 1 12888.6 12888.59 3.436746 0.07133587 • Residuals 39 146259.0 3750.23
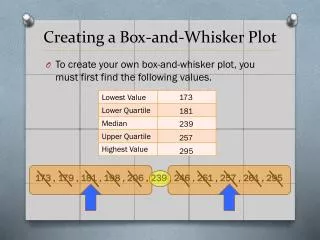
Summary Statistics Group 1-6 Group:4 Volume Mean: 86.11111 Total N: 9.00000 Std Dev.: 56.22154 ------------------------------------- Group:5 Volume Mean: 12 Total N: 1 Std Dev.: NA --------------------------------------- Group:6 Volume Mean: 63.60000 Total N: 5.00000 Std Dev.: 63.49646 • Group:1 • Volume • Mean: 103.33333 • Total N: 6.00000 • Std Dev.: 49.26121 • ------------------------------- • Group:2 • Volume • Mean: 128.80000 • Total N: 10.00000 • Std Dev.: 60.75232 • ------------------------------- • Group:3 • Volume • Mean: 18.100000 • Total N: 10.000000 • Std Dev.: 9.780366 • -------------------------------
Multiple Comparisons • Under “Statistics,” click “ANOVA,” then “Multiple Comparisons” • You can compare the means and get confidence intervals for the groups. • You can rename the groups so they are to your interest • Ex. Combine Group 1 and 2 by making them Group 7 • Zero must be in the confidence interval. Otherwise there is a difference between the groups.