Download
1 / 5
50 likes | 170 Views
a f and t of the TaqMan probe sequence indicate the fluorescence labels FAM and TAMRA, respectively. WT. *. *. d3. *. *. d14. *. *. *. P content (μg/mg DW). d10. *. *. d17. *. *. +Pi -Pi. +Pi -Pi. +Pi -Pi.

E N D
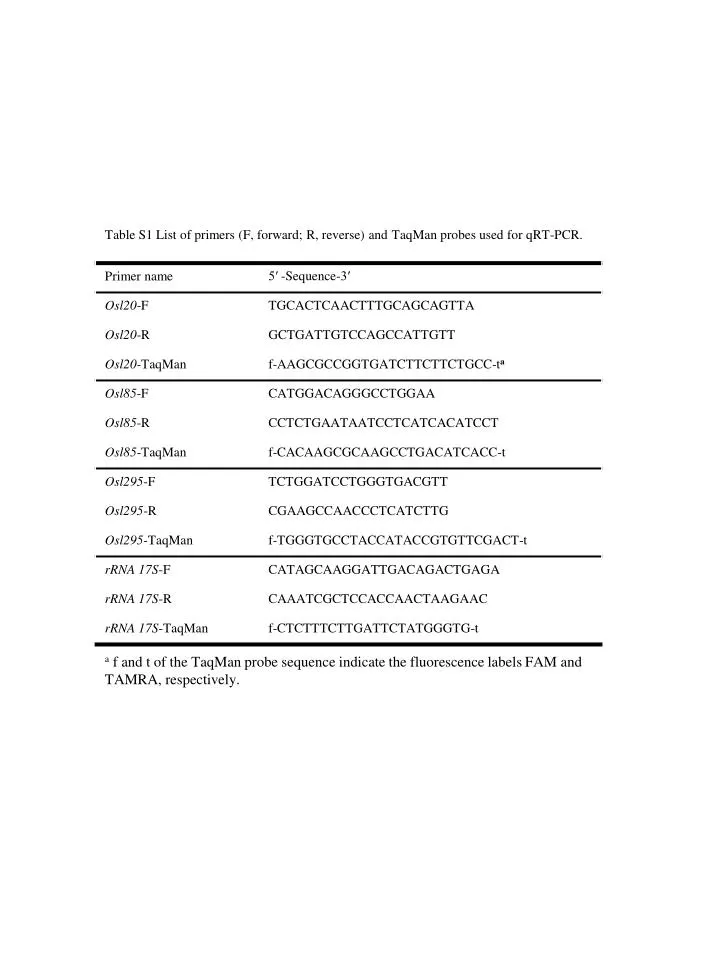
af and t of the TaqMan probe sequence indicate the fluorescence labels FAM and TAMRA, respectively.
WT * * d3 * * d14 * * * P content (μg/mgDW) d10 * * d17 * * +Pi -Pi +Pi -Pi +Pi -Pi Fig. S1 Phosphorus content of rice seedlings grown in hydroponic culture medium with (+P) or without (–P) phosphate. The third leaf, shoot without the third leaf, and roots were cut from the 2-week-old seedlings. Phosphorus content was determined using the molybdate–vanadate yellow method. Data are the mean ± SE (n = 3; *, significant difference between the two treatments at P <0.05, t-test). 3rd leaf Shoot Root
GR24 GR24 d14 WT d3 + - + - + - +Pi +Pi +Pi Fig. S2 Effects of GR24 on leaf segments grown with (+P) or without (–P) phosphate. The addition of 1 µM GR24 accelerated leaf senescence in the wild-type, d3, d14, d10 , and d17. Differences in leaf color were clearly observed by the third day after the GR24 treatment. The scale bar indicates 2 cm. + - + - + - -Pi -Pi -Pi d10 + - +Pi + - -Pi 0 2 3 4 (day) d17 + - +Pi + - -Pi 0 2 3 4 (day)
GR24 WT d10 0 0.01 0.1 1 10 (μM) +Pi -Pi +Pi -Pi Fig. S3 Dose-dependency of the response to GR24 with (+Pi) or without (–Pi) phosphate. Photos show the leaf senescence phenotype of the WT and d10 grown in hydroponic culture medium containing various concentrations of GR24. The scale bar indicates 2 cm.
A GR24 - +Pi + - -Pi + WT d3 d14 d10 d17 1st leaf tiller B 2nd leaf tiller No. of outgrowing tillers d14 d10 d17 d14 d10 d17 d14 d10 d17 d14 d10 d17 WT WT WT WT d3 d3 d3 d3 - + - + GR24 Fig. S4 Effects of GR24 on tiller bud outgrowth in rice. A Tillers of the wild-type (WT) and d mutants tillers 8 day after transferring into hydroponic culture medium (+Pi) or without (–Pi) phosphate in the presence or absence of 1 µM GR24. The scale bar indicates 1 cm. B The first and second tillers. Total number of tillers (over 1 mm) in 16 seedlings is shown. +Pi -Pi