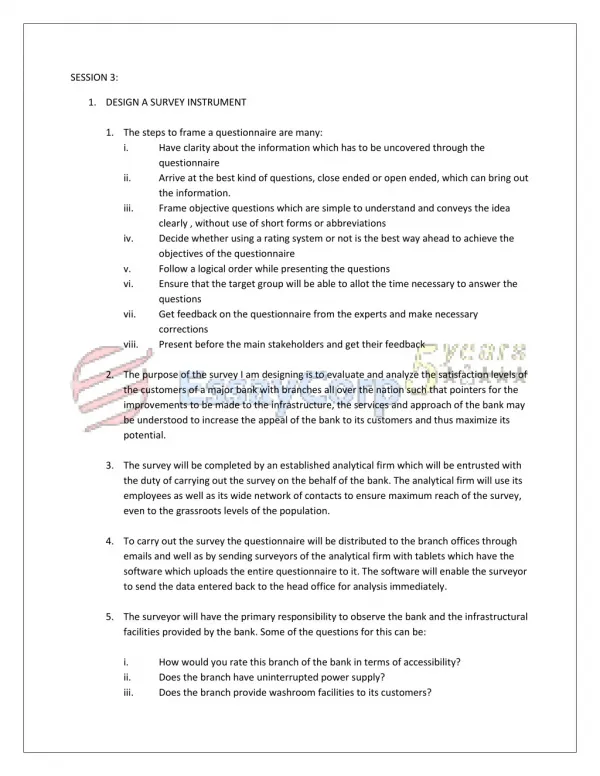
Download

1 / 17
180 likes | 426 Views
Data Collection and Presentation. Step 3 and Step 7. Data collection does not need to be lengthy process with lots of grading or time consuming data entry. Both pre-assessment and post assessment can be done in just a couple of minutes. Methods of data collection. Consensogram

E N D
Step 3 and Step 7 • Data collection does not need to be lengthy process with lots of grading or time consuming data entry. • Both pre-assessment and post assessment can be done in just a couple of minutes.
Methods of data collection • Consensogram • Students write a number indicating their knowledge on a topic • on a post it • on an assignment • or at the end of an assessment • as a closer/ anticipatory set • Yes or no questions • Pre-test & Post-test • At the end of the unit exam, add 3 questions from next cycle. • Poll on your google website.
More data collection • Graded assignments • Labs, projects, essays, homework • Can be just two or three questions from that document rather than the whole thing • Can be one part of a rubric (i.e. just voice) rather than the whole thing • Selecting a small number of questions from an assessment you already have • Clickers/Cell Phones
ENG 101 Period 1 and 2 Body Paragraph Consensogram – Pre Assessment On a post it – please put the number where you feel identifies your comfort level/ability with writing body paragraphs! No names – just the number! This is your ticket out the door!
ENG 101 Period 1 and 2 Body Paragraph Consensogram – Pre & Post Assessment Pre-Test: 23% at Mastery Level Post-Test: 93% at Mastery Level
Pie Charts • Good for comparing percentages. • Try to stay away from class averages • Can only do one class or one assessment at a time.
Bar Graph • Can compare multiple classes or multiple assessments. • Easy to see how classes compare or the comparison between pre/post test.
Every graph should include: • Title • Labels on both axes • Legend for any data sets (multiple lines or bars)
Title of Graph • Click on the graph • Under the Layout tab • Title should be descriptive • Example: rather than just Unit 1, what about Unit 1?
X (horizontal) Axis • Almost always have to add your label • Will usually be the type of assessment, grade range on the assessment, or level of understanding • Time will be on this axis
Y (vertical) axis • Add your label • This will usually be the number of students • Make sure to scale your axis appropriately • If it looks off, change the scale
Displaying Data • Once you have collected your data, you will need to display it on the board in your classroom. • There are a lot of easy ways to do this electronically. • Today we are going to show you how to display your data in pie charts, bar graphs, and line graphs