Download
1 / 1
10 likes | 158 Views
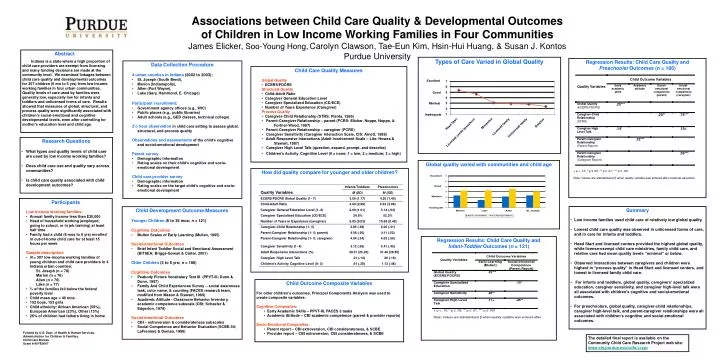
Regression Results: Child Care Quality and Preschooler Outcomes (n = 186). Types of Care Varied in Global Quality. Global quality varied with communities and child age. Regression Results: Child Care Quality and Infant-Toddler Outcomes ( n = 121).

E N D
Regression Results: Child Care Quality and Preschooler Outcomes (n = 186) Types of Care Varied in Global Quality Global quality varied with communities and child age Regression Results: Child Care Quality and Infant-Toddler Outcomes (n = 121) Associations between Child Care Quality & Developmental Outcomes of Children in Low Income Working Families in Four Communities James Elicker, Soo-Young Hong,Carolyn Clawson, Tae-Eun Kim, Hsin-Hui Huang, & Susan J. Kontos Purdue University Abstract Indiana is a state where a high proportion of child care providers are exempt from licensing and many funding decisions are made at the community level. We examined linkages between child care quality and developmental outcomes for 307 children (6 mo to 6 yrs) from low income working families in four urban communities. Quality levels of care used by families were generally low, especially low for infants and toddlers and unlicensed forms of care. Results showed that measures of global, structural, and process quality were significantly associated with children’s social-emotional and cognitive developmental levels, even after controlling for mother’s education level and child age. • Data Collection Procedure • 4 urban counties in Indiana (2002 to 2003): • St. Joseph (South Bend), • Marion (Indianapolis), • Allen (Fort Wayne), • Lake (Gary, Hammond, E. Chicago) • Participantrecruitment: • Government agency offices (e.g., WIC) • Public places (e.g., public libraries) • Adult schools (e.g., GED classes, technical college) • 2½ hour observation in child care setting to assess global, structural, and process quality • Observations and assessments of the child’s cognitive and social-emotional development • Parent survey • Demographic information • Rating scales on their child’s cognitive and socio-emotional development • Child care provider survey • Demographic information • Rating scales on the target child’s cognitive and socio-emotional development • Child Care Quality Measures • Global Quality • ECERS/FDCRS • Structural Quality • Child-Adult Ratio • Caregiver General Education Level • Caregiver Specialized Education (CD/ECE) • Number of Years Experience (Caregiver) • Process Quality • Caregiver-Child Relationship (STRS: Pianta, 1996) • Parent-Caregiver Relationship – parent (PCRS: Elicker, Noppe, Noppe, & • Fortner-Wood, 1997) • Parent-Caregiver Relationship – caregiver (PCRS) • Caregiver Sensitivity (Caregiver Interaction Scale, CIS: Arnett, 1989) • Adult Responsive Interactions (Adult Involvement Scale – Lite: Howes & • Stewart, 1987) • Caregiver High Level Talk (question, expand, prompt, and describe) • Children’s ActivityCognitive Level (0 = none; 1 = low; 2 = medium; 3 = high) • Research Questions • What types and quality levels of child care are used by low income working families? • Does child care use and quality vary across communities? • Is child care quality associated with child development outcomes? How did quality compare for youngerand older children? • Participants • Low income working families: • Annual family income less than $35,000 • Head of household working (employed, going to school, or in job training) at least half time • Family had a child (6 mos to 6 yrs) enrolled in out-of-home child care for at least 15 hours per week • Sample description: • N = 307 low-income working families of young children and child care providers in 4 Indiana urban counties: • St. Joseph (n = 78) • Marion (n = 76) • Allen (n = 76) • Lake (n = 77) • ⅔ of the families fell below the federal poverty level • Child mean age = 40 mos. • 152 boys, 153 girls • Child ethnicity: African American (59%), European American (23%), Other (13%) • 26% of children had fathers living in home • Summary • Low income families used child care of relatively low global quality. • Lowest child care quality was observed in unlicensed forms of care, and in care for infants and toddlers. • Head Start and licensed centers provided the highest global quality, while license-exempt child care ministries, family child care, and relative care had mean quality levels “minimal” or below. • Observed interactions between caregivers and children were highest in “process quality” in Head Start and licensed centers, and lowest in licensed family child care. • For infants and toddlers, global quality, caregivers’ specialized education, caregiver sensitivity, and caregiver high-level talk were all associated with children’s cognitive and social-emotional outcomes. • For preschoolers, global quality, caregiver-child relationships, caregiver high-level talk, and parent-caregiver relationships were all associated with children’s cognitive and social-emotional outcomes. • Child Development Outcome Measures • Younger Children (6 to 35 mos; n = 121) • Cognitive Outcomes • Mullen Scales of Early Learning (Mullen, 1995) • Social-emotional Outcomes • Brief Infant Toddler Social and Emotional Assessment (BITSEA; Briggs-Gowan & Carter, 2001) • Older Children (3 to 6 yrs; n = 186) • Cognitive Outcomes • Peabody Picture Vocabulary Test III (PPVT-III; Dunn & Dunn, 1997) • Family And Child Experiences Survey – social awareness task, color name, & counting (FACES research team, modified from Mason & Stewart, 1989) • Academic Attitude - Classroom Behavior Inventory, academic competence subscale (CBI; Schaefer & Edgerton, 1978) • Social-emotional Outcomes • CBI – extroversion & considerateness subscales • Social Competence and Behavior Evaluation (SCBE-30; LaFreniere & Dumas, 1996) • Child Outcome Composite Variables • For older children’s outcomes, Principal Components Analysis was used to create composite variables: • Cognitive Composites: • Early Academic Skills – PPVT-III, FACES 3 tasks • Academic Attitude – CBI academic competence (parent & provider reports) • Socio-Emotional Composites: • Parent report – CBI extroversion, CBI considerateness, & SCBE • Provider report – CBI extroversion, CBI considerateness, & SCBE Funded by U.S. Dept. of Health & Human Services, Administration for Children & Families, Child Care Bureau Grant # 90YE0047 The detailed final report is available on the Community Child Care Research Project web site: www.cfs.purdue.edu/cdfs/cccpr