Download
1 / 16
160 likes | 288 Views
MAKING BAR GRAPHS WITH 2 or 3 SERIES. In this tutorial you will learn how to go from this BIG table to. Click here!. 1 All the females from London 2 All the males from London. 3 All the females from Paris 4 All the males from Paris. 5 All the females from Quebec

E N D
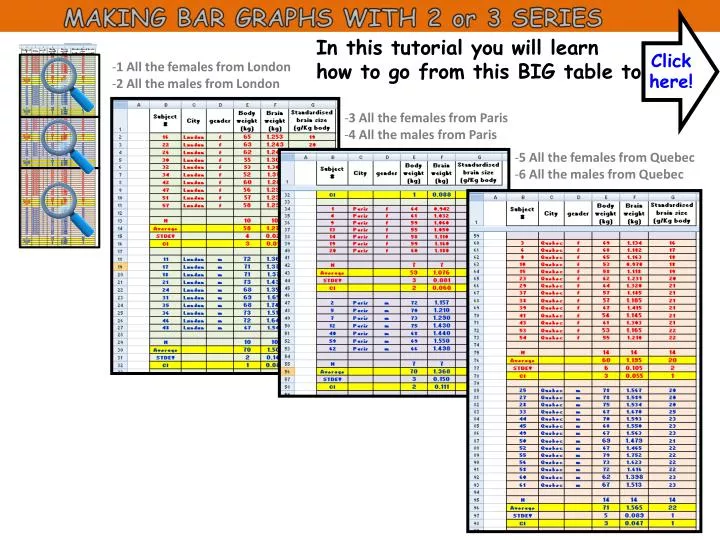
MAKING BAR GRAPHS WITH 2 or 3 SERIES In this tutorial you will learn how to go from this BIG table to Click here! • 1 All the females from London • 2 All the males from London • 3 All the females from Paris • 4 All the males from Paris • 5 All the females from Quebec • 6 All the males from Quebec
MAKING BAR GRAPHS WITH 2 or 3 SERIES 3 series -> Average Brain weight of Londoners -> Average Brain weight of Parisians -> Average Brain weight of Quebecers THAT 2 series -> Average Brain weight of Females -> Average Brain weight of Males 2 categories -> Female & Male 3 categories -> London, Paris & Quebec
In Excel 2&3we saw that females’ brains were significantly smaller than the males'. We standardised brain size relatively to body weight and this gender difference vanished We gathered other data (from London and Quebec) to confirm our finding. We have now a big table and now we have to graph it. I will assume that you possess a basic knowledge of Excel (see Tutorials 1,2,3 &4) The big table is coming on the next slide
Collapse the table – This table is big and hard to manage. We just need the averages and confidence intervals for our bar graph so we will hide (not delete) all the rows containing values for individual subjects • 1 All the females from London • 2 All the males from London • 3 All the females from Paris • 4 All the males from Paris • 5 All the females from Quebec • 6 All the males from Quebec • Hide the subjects: you do not need them to make your graphs! • 1- Select the rows you want to hide • 2- Use the “Hide” tool to hide them
Collapse the table – • 1- Select the rows you want to hide • 2- Use the “Hide” tool to hide them HIDE NOT DELETE! I just hit delete and my data got deleted. HIDE! Don’t cry! Click undo”. HIDE! HIDE! HIDE! HIDE! The table is smaller and easier to manage. If you want your data to re-appear just hit “unhide” HIDE!
Making bar graphs -> 2 series (Males & Females) 2 series -> Average Brain weight of Females -> Average Brain weight of Males 3 categories -> London, Paris & Quebec
Making bar graphs -> 3 series (London, Paris & Quebec) 3 series -> Average Brain weight of Londoners -> Average Brain weight of Parisians -> Average Brain weight of Quebecers 2 categories -> Female & Male You do not need to do this graph from scratch. Modify a copy of the graph you did previously (it’s faster)
5- Making bar graphs -> Data series 3 series -> Average Brain weight of Londoners -> Average Brain weight of Parisians -> Average Brain weight of Quebecers 2 series -> Average Brain weight of Females -> Average Brain weight of Males 2 categories -> Female & Male 3 categories -> London, Paris & Quebec
5- Making bar graphs -> Data series 3 series -> Average Brain weight of Londoners -> Average Brain weight of Parisians -> Average Brain weight of Quebecers 2 series -> Average Brain weight of Females -> Average Brain weight of Males 2 categories -> Female & Male 3 categories -> London, Paris & Quebec
6- Making bar graphs -> graphing Males & Females as series 2 series -> Average Brain weight of Females -> Average Brain weight of Males 3 categories -> London, Paris & Quebec
7- Making bar graphs -> graphing London, Paris & Quebec as series Don’t do this graph from scratch. Modify a copy of the one you did in Slide 6 3 series -> Average Brain weight of Londoners -> Average Brain weight of Parisians -> Average Brain weight of Quebecers 2 categories -> Female & Male
Making bar graphs -> graphing the standardised Brain ...in less than 4 min.
It looks like the brain of women are significantly smaller than the brain of men. If we standardise brain size relatively to body weight, there is no significant difference between genders except with the Quebecers. Are these results meaningful? Brain weight may change over a life span... We do not know the age of our subjects and these samples may not be controlled for age. We may compare old women with young males .... and observe the effect of aging as well as gender. (*) In Biol 363 we will assume that means are significantly different from each other if their confidence intervals do not overlap - (in “real life” you should be doing proper statistical analysis!)