Download
1 / 10
110 likes | 221 Views
Multi-Dimensional Data Visualization 2. cs5984: Information Visualization Chris North. Assignment. Read for Tues: Tweedie&Spence, “Externalizing Abstract Mathematical Models” (Influence Explorer), p276 ravi, mark Keim, “VisDB”, p126 ameya, sanjini Read for Thurs:

E N D
Multi-Dimensional Data Visualization 2 cs5984: Information Visualization Chris North
Assignment • Read for Tues: • Tweedie&Spence, “Externalizing Abstract Mathematical Models” (Influence Explorer), p276 • ravi, mark • Keim, “VisDB”, p126 • ameya, sanjini • Read for Thurs: • Fishkin, “Movable filters” (Magic Lens), p253 • prasuna, umer • Doan, “Query Previews”, web page • aarthi, ameya
Homework #1: Due Thurs Feb 1 • Get some data (>=1000 items, >=6 attributes) not demo data! • Visualize it (>=2 tools) • Spotfire, Advizor/SeeIt, Table Lens, Parallel Coordinates • Written report (2-3 pages) • individual • data: • X Usability – Rex hartson • eye-tracking - Debby hix -satya, prasuna • Biotech – lenny Heath, naren R -margaret (maellis1), maulik, sumithra • NASA - Layne watson -sanjini, aarthi • dept - Cliff Shaffer -purvi • univ - Dennis kafura • software eng - Steve Edwards -umer • survey data - Jan lee -dilshad
Today • Rao, “Table Lens”, p343,597 • marty e, purvi
Today • Feiner, “Worlds within Worlds”, p96 • Me, Ajay
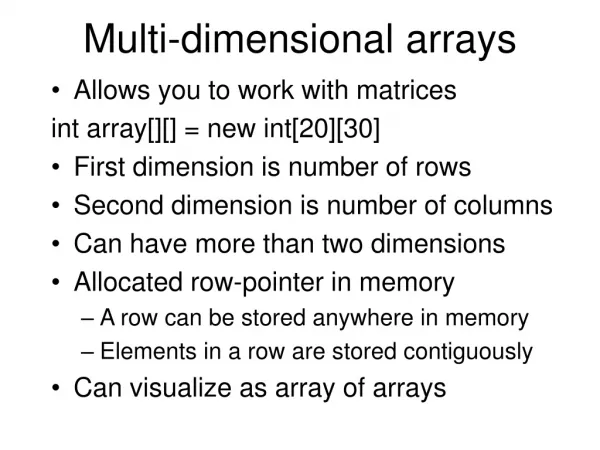
Nested Axes • (a,b,c,d) • (1,2,3,4) B B D C A A
Nested Axes • (a,b,c,d): d=f(a,b,c) • E.g. 2=f(1,2,0) B B D ? C A A
7d: value=f(strike,spot,time,domestic,foreign,volatility) • Max D = 6 ? > 1 nesting gets cumbersome • Not much on its value to user • Apply to 2D display? • No overview of data • Good dynamics • Great for functions, not good for data points