Download

1 / 42
420 likes | 613 Views
QC and pre-processing of microarray data. Lars Eijssen - BiGCaT Bioinformatics. Contents. Background on quality control (QC) and (further) data pre-processing Application of an automated workflow for Affymetrix data Settings Illustration on data sets Interpretation of outcome

E N D
QC and pre-processingof microarray data Lars Eijssen - BiGCaT Bioinformatics
Contents • Background on quality control (QC) and (further) data pre-processing • Application of an automated workflow for Affymetrix data • Settings • Illustration on data sets • Interpretation of outcome • Introduction to the afternoon session and the data set to be used
Proper quality control (QC) • Ensures validity of study results • Is pivotal in –omics research • Hard to judge quality by eye • Several tables and images assist in judging quality • Here we focus on QC of gene expression arrays
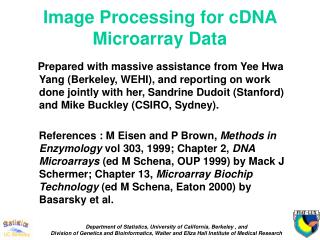
Data analysis overview Microarray scans Image analysis Raw data • Background correction • Normalisation Quality control Further pre-processing Normalised data Statistical analysis List of regulated genes Pattern analysis Pathway analysis Literature data Results Untreated (control) Exposed to compound Slidebasedon a slidefrom J. Pennings, RIVM, NL
QC and pre-processing • Ensure signal comparability within each array • Stains on the array • Gradient over the array • Ensure comparable signals between all arrays • Degraded / low quality sample • Failed hybridisation • Too low or high overall intensity • Some effects can be corrected for, others require removal of data from the set
QC for one and two channel microarrays • The principles are similar for both types of arays • But the details are different • In two channel arrays QC is a bit more complex • Each spot consists of two measurements, not one • Dye-effect • I will further discuss QC later in this talk, focusing on one channel arrays (Affymetrix chips)
Dye bias Foreground intensity Background intensity
Red and green foreground intensity For two channel arrays, it is relevant to check whether effects cancel out between channels
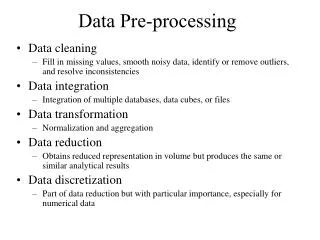
Pre-processing: background correction • Background signal needs to be corrected for • For example signal of remaining non-hybridised mRNA • Three types of background • Overall slide background • Local slide background • Specific background • For example cross-hybridization, can be corrected for by mismatch probes (in case of Affymetrix chips) • Also used to make present/marginal/absent calls
Pre-processing: normalisation • After discarding bad arrays and spots, remaining within- and between-array differences not related to the biology, need to be corrected for • The procedure is cyclic • Several QC plots are made before and after normalisation • Whether normalisation can correct an artifact may influence decision to discard or not • After data selection, the complete QC should be run again • Some abberations may have been masked by larger ones
Log transformation • Generally, the intensities are first2log-transformed • The distribution of the loggedintensities is more ‘normal’ thanon the originalscale • Log transformed data are easier to handlestatistically Thiswillbeexplained more in the lectureonstatistics
Main focus in remainder of talk Spotted and Affymetrix arrays Spotted arrays • Either one or two channel • Spot-level QC often included • Also often parts of arrays are flagged • Each gene is measured by only one or two probes on the array Affymetrix chips • Always one channel • no dye effect • No spot-level QC is taken into account • No flagging of local abberations • Each gene is measured by a probeset of probes spread randomly over the array
Pre-processing for Affymetrix chips • A specific extra step is summarisation of probe values into one value for each probeset • Well-known methods for pre-processing Affymetrix chips • MAS5.0 (uses mismatch intensities) • RMA (Robust Multiarray Average, does not use mismatches) • Includes both background correction and (quantile) normalisation • GC-RMA (like RMA, but also takes into account GC content) • dChip (model-based) • For exonST en geneST arrays, only RMA can be used (another option is PLIER, error-model)
Custom CDF files • Affymetrix provides annotations for their probesets (CDF file) • When these get outdated, one can of course update probeset annotations • But it may be even better to: • disassemble these sets into the separate probes • reannotate probes • reassemble these into new different probesets • This is exactly what custom CDF files do • Note that reassembled probesets do not necessarily contain the same number of probes anymore
BrainArray CDF files1 • Reannotation based on one of several genome databases • IDs are created as follows: ID from the gene the probeset refers to followed by ‘_at’ to resemble an Affymetrix ID • For example: ENSG00000139618_at • When using these annotations in other tools, you have to remove the ‘_at’ additions, in order to get recognisable Ids • Note that when using Entrez gene this means that the ID is composed of a number (Entrez gene ID) followed by ‘_at’, and as such looks exactly like a normal Affymetrix ID, but IT IS NOT 1 http://arrayanalysis.mbni.med.umich.edu/arrayanalysis.html
Low intensity filtering • Before filtering • After filtering • Low intensity spots are more subject to noise • Filtering canbedone at a later stage difference between groups average intensity
ArrayAnalysis.org local machine web server calculation server
Outcome of the workflow Table and images of QC statistics Affymetrix criteria: • Sample prep controls Lys < Phe < Thr < Dap • Lys present • Bèta Actin 3’/5’ ≤ 3 • GAPDH 3’/5’ ≤ 1.25 • Hybridisation controls BioB < BioC < BioD < Crex • BioB present • Percentage present within 10% • Background within 20 units • Scaling factors within 3-fold from the average In the table, red and blue indicate whether criteria are fulfilled The images are taken from other data sets than the one you will be using
Perspectives • Future relevance of Affymetrix chips? • Data repositories / comparative research • It is also available for local install in R • We will soon include model for statistical analysis (and processing of other data types)
Quality Control (QC) of Microarrays • Nature, 2005
Project members Thanks to: Lars Eijssen Magali Jaillard Michiel Adriaens Chris Evelo Philip de Groot
The afternoon session • In the afternoon session, you will be performing QC and pre-processing yourself • You will follow a stepwise guide available online atthe course wiki • You will use an Affymetrix data set and make use of arrayanalysis.org
Short description of the data set (1) • Microarray experiments have to be uploaded to online repositories such as Gene Expression Omnibus (GEO, NCBI) or ArrayExpress (AE, EBI) upon publication • We will use apublished1 datasetavailable from AE 1 Toxicogenomics of subchronichexachlorobenzene exposure in Brown Norway rats. Ezendam J, Staedtler F, Pennings J, et al. Environ Health Perspect 112(7):782-91
Short description of the data set (2) • Hexachlorobenzene (HCB) is a persistent pollutant, that is toxic for liver, neurons and the reproductive and immune systems • In this study, Brown Norway rats were fed a diet supplemented with HCB doses of 0, 150, or 450 mg/kg • Spleen, mesenteric lymph nodes (MLN), thymus, blood, liver, and kidney were analyzed using the Affymetrix rat RGU-34A GeneChip microarray • 13-17 arrays per tissue, max 6 per concentration • We will be primarily considering the liver data (17 arrays)