Download

1 / 40
400 likes | 487 Views
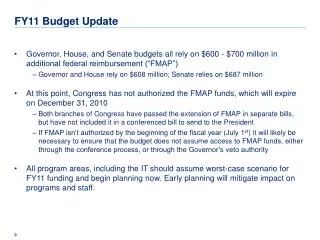
Accountability in FY11. AYP. Accountability: The Old and The New. School Grade: First 800 points – FCAT High Standards Learning Gains L25% HS Bonus Points AYP FY11 Targets Graduation Rate criteria. Test your knowledge – T or F.

E N D
Accountability: The Old and The New • School Grade: First 800 points – FCAT • High Standards • Learning Gains • L25% • HS Bonus Points • AYP • FY11 Targets • Graduation Rate criteria
Test your knowledge – T or F • High standard calculations include eligible students in surveys 2 and 3 who are present during the first day of testing. • A score of 4 or higher on FCAT Writing is now required for high standards. • Florida Alternate Assessment (FAA) students are included in Learning Gains. • Lowest 25% students do not include FAA students. • The proficiency target for AYP Reading is 79%.
FY11 School Grade • Who is included in High Standards calculation? • Eligible Students • Surveys 2 & 3 • Enrolled 1st day of testing • Standard Curriculum Students: • (includes ELL students >2 years in ESOL) and • ESE (Gifted, Hospital/Homebound, Speech Impaired)
FY11 School Grade • Who is included in Learning Gains calculation? • Eligible Students • Surveys 2 & 3 • Enrolled 1st day testing • Current/prior FCAT scores • Current /prior FAA scores • Students referred to Alternative School receiving School Improvement Rating
FY11 School Grade • Who is included in Lowest 25% calculation? • Eligible Students • Surveys 2 & 3 • Enrolled 1st day testing • Current/prior FCAT scores • Lowest Quartile • Does not include • Levels 4 and 5 • FAA students • Alt. School students
FY11 School Grade • Who is included in Bonus Points calculation? • Standard curriculum students • Grades 11 or 12 • Surveys 2 & 3 in current/prior year • Current year: enrolled 1st day of testing • FCAT graduation requirement not met in March 2010
FY11 School Grade • FCAT 2.0 (Gr. 3-10) • Aligned to NGSSS • Meets FCAT 2.0 Specifications • High Standards: • Level 3, 4, and 5
FY11 School Grade • FCAT 2.0 (Gr. 3-8) • Aligned to NGSSS • Meets FCAT 2.0 Specifications • FCAT (Gr. 10) * • Aligned to SSS • Meets FCAT Specifications • High Standards: • Level 3, 4 and 5 • *Computer-based test
Increasing Rigor with the Next Generation Sunshine State Standards in Mathematics Sample Benchmark Comparisons Old (1996) Standards vs. NGSSS
SSS Solution: 1 step Student identifies operation. Grade 5 Mathematics NGSSS Solution: 2 steps Student converts fractions and mixed number, then adds.
SSS Solution: 2 steps 5.75 x 12 = 69 inches 69 ÷ 10 = 6.9 inches Grade 8 Mathematics NGSSS • Solution: 4 steps7 x12 = 84 + 10 = 94 inches • 24 x 2 = 48 inches • 48 + 38 = 86 inches • 94 – 86 = 8 inches
FY11 School Grade • FCAT (Gr. 4, 8, 10) • Aligned to SSS • Meets Specifications Guidelines • High Standards: • 4, 5 and 6 score
FY10 FCAT Writing Scores School Change: FY10 Calculation (3+ and 4+) vs. FY11 Calculation (4+) Elementary Schools 5 10 15 21 26
FY10 FCAT Writing Scores School Change: FY10 Calculation (3+ and 4+) vs. FY11 Calculation (4+) Middle Schools 13 5
FY10 FCAT Writing Scores School Change: FY10 Calculation (3+ and 4+) vs. FY11 Calculation (4+) High Schools 18 3
FY10 FCAT Writing Scores School Change: FY10 Calculation (3+ and 4+) vs. FY11 Calculation (4+) Charter Schools 36 5
FY11 School Grade • FCAT (Gr. 5, 8, 11) • Aligned to SSS • Meets FCAT Specifications • High Standards: • Levels 3, 4 and 5
FY11 School Grade • FCAT 2.0 (Gr. 3-10) • Learning Gains: • Go up a level • Maintain same proficiency level • More than one year’s DSS growth (L1-L2:not retained) • Florida Alternate Assessment • Learning Gains: • Go up a level • Maintain same proficiency level
FY11 School Grade • FCAT 2.0 (Grades 3-8) • FCAT (Gr. 10) • Learning Gains: • Go up a level • Maintain same proficiency level • More than one year’s DSS growth (L1-L2:not retained) • Florida Alternate Assessment • Learning Gains: • Go up a level • Maintain same proficiency level
FY11 School Grade • FCAT 2.0 (Gr. 3-10) • Learning Gains: • Go up a level • Maintain same proficiency level • Make more than one year’s DSS growth (L1-L2:not retained)
FY11 School Grade • FCAT 2.0 (Gr. 3-8) • FCAT (Gr. 10) • Learning Gains: • Go up a level • Maintain same proficiency level • Make more than one year’s DSS growth (L1-L2:not retained)
FY11 School Grade • FCAT Retake – Reading • FCAT Graduation Requirement: • Scale Score > 300 • Developmental Scale Score > 1926
FY11 School Grade • FCAT Retake – Mathematics • FCAT Graduation Requirement: • Scale Score > 300 • Developmental Scale Score > 1889
AYP AYP
FY11 AYP Graduation rate goal = 85% or Show annual improvement of at least 2%
Link to Accountability Web Page: School Grade and AYP Questions and Answers http://www.palmbeachschools.org/assessment/SchoolGrade.asp
Improving Student Learning Practices
School Factors Guaranteed and Viable Curriculum: Opportunity to Learn OTL affects student achievement more than double any other school factors. Percentile Gain* * The average gain in percentile points of the average student in the experimental group compared to the average student in the control group. Marzano, R., 2000; Borman, G.D.; Hewes, G.M. et al., 2000