Download
1 / 52
520 likes | 543 Views
Commodities and emerging markets. The resource curse. Svetlana Ledyaeva Aalto BIZ. Commodities. Changeability.

E N D
Commodities and emerging markets. The resource curse Svetlana Ledyaeva Aalto BIZ
Commodities Changeability A commodity is an economic good or service that has full or substantial fungibility: that is, the market treats instances of the good as equivalent or nearly so with no regard to who produced them. The price of a commodity good is typically determined as a function of its market as a whole: well-established physical commodities have actively traded spot and derivative markets. Most commodities are raw materials, basic resources, or agricultural products, such as iron ore, sugar, or rice.
Performance of each emerging market in 2016 and their correlations to gold, silver, oil and the Bloomberg Commodity Index YTD-year to date
PERCEPTION The common wisdom says that the relative performance of emerging markets is linked to the performance of commodities, so some investors may think that “betting” on emerging markets might be similar to “betting” on commodities. The thought process behind this is that some of the big oil exporters are based in emerging markets, like the Arabian Gulf countries, Russia, Venezuela, Nigeria, Libya, Mexico, etc. Also, some of the big exporters of industrial metals, grain, etc. are Brazil, South Africa, Russia, Argentina, etc. Simultaneously, developed markets are the consumers of all of those commodities.
REALITY The graph above shows the correlation between the relative performance of MSCI Emerging Markets $ (vs MSCI Developed Markets $) vs. the GS Commodity Spot Index for 7 years. The correlation between them was 0.08
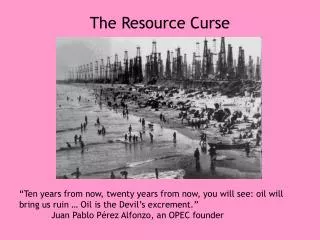
Natural resources curse The term resource curse encompasses the significant social, economic and political challenges that are unique to countries rich in oil, gas and minerals. Many oil-, gas- and mineral-rich countries have failed to reach their full potential as a result of their natural resource wealth. In general, they are also more authoritarian, more prone to conflict, and less economically stable than countries without these resources.
Resource curse in Emergingeconomies The worst development outcomes - measured in poverty, inequality, and deprivation - are often found in those countries with the greatest natural resource endowments. "There are twenty-three countries in the world that derive at least 60 percent of their exports from oil and gas and not a single one is a real democracy," observes Larry Diamond of Stanford University.
Mineral resources and economic development African countries (Angola, Nigeria, Sudan) rich in resourcesLow per capita income and low quality of life. East Asian economies Japan, Korea, Taiwan, Singapore and Hong Kong have achieved western-level standards of living despite being rocky islands (or peninsulas) with virtually no exportable natural resources.
Possible Channels of the Natural Resource Curse It is not that countries with oil wealth will necessarily achieve worse performance than those without. The question is why does oil lead to success in some cases and failure in others. What leads to the achievements of Norway and the disappointments of Nigeria?
Democracy:Oversight incentives in resource-rich and resource-poor countries
Conflict Natural resources can, and often do, provoke and sustain internal conflicts as different groups fight for control of the resources or use natural resources to finance their fighting. The tendency of oil-rich states to instigate or be targets of international conflict, has been observed in some cases, such as with Iraq’s invasion of Iran and Kuwait.
Weakerinstitutionaldevelopment Institutions can be weaker in resource-rich countries because it is easy for elites to capture or take large sums of cash. Rent-seeking and rent-seizing Corruption and week institutions.
Possible Channels of the Natural Resource Curse A prominent trend in thinking regarding economic development is that the quality of institutions is the deep fundamental factor that determines which countries experience good performance and which do not. In high-rent countries the natural resource elicits a political contest to capture ownership In low-rent countries the government must motivate people to create wealth: by pursuing comparative advantage, promoting equality, and fostering civil society. Mehlum, Moene, and Torvik (2006), Robinson, Torvik and Verdier (2006), McSherry (2006) and Smith (2007) suggest that the important question is whether the country already has good institutions at the time that oil is discovered, in which case it is more likely to be put to use for the national welfare instead of the welfare of an elite.
Price arguments Prices of commodities/resources could be subject to secular decline on world markets. The hypothesis that the prices of mineral and agricultural products follow a downward trajectory in the long run, relative to the prices of manufactures and other products, is associated with Paul Prebisch (1950) and Hans Singer (1950), and what used to be called the “structuralist school”. The theoretical reasoning was that world demand for primary products is inelastic with respect to world income. That is, for every one percent increase in income, the demand for raw materials increases by less than one percent. There also exist persuasive theoretical arguments that we should expect prices of oil and other minerals to experience upward trends in the long run. Hotelling(1931) deduced from these assumptions the important theoretical principle that the price of oil in the long run should rise at a rate equal to the interest rate. Empirical evidence: Terms of trade for commodity producers had a slight upward trend from 1870 to World War I, a downward trend in the inter-war period, upward in the 1970s, downward in the 1980s and 1990s, and upward in the first decade of the 21st century.
Medium-term Volatility of Commodity Prices The price of oil does not follow a smooth path, whether upward or downward. Even prices of other mineral and agricultural commodity prices are far more volatile than prices of most manufactured products or services. In general commoditypricevolatilityhasnegativeimpact on economicgrowth.
Volatileprices Inefficientspending and borrowing The amount that governments collect in resource revenues can change drastically from year to year because of changes in commodities prices and production. Several studies have shown that it is very difficult to effectively spend fluctuating and unpredictable revenues. Russian successful example: Stabilization fund of the Russian Federation
Stabilization fund of Russia The Stabilization fund of the Russian Federation ("the Fund") was established on January 1, 2004 as a part of the federal budget to balance the federal budget at the time of when oil price falls below a cut-off price. In 2008 it was divided into Reserve fund and National Wealth Fund. The capital of the Fund may be used to cover the federal budget deficit and for other purposes. Due to crisis in Russia, by 01.01.2018, the Reserve fund was spent off (On 01.02.2008 it wasequal to 125.19 billion USD). Now National Wealth Fund will be used for further expenses (75.59 billion USD on 01.11.2018),
Political resource course (Brollo et al. 2013, American Economic Review) This paper studies the effect of additional government revenues on political corruption and on the quality of politicians, both with theory and data (data is for Brazil). The empirical evidence shows that larger transfers increase observed corruption and reduce the average education of candidates for mayor.
Dutch disease: History and definition Is the apparent relationship between the increase in exploitation of natural resources and a decline in the manufacturing sector (or agriculture). The term was coined in 1977 by The Economist: The decline of the manufacturing sector in the Netherlands after the discovery of a large natural gas field in 1959. Bad institutions: prerequisite for Dutch disease.
Dutch disease vs.resource curse are often used interchangeable, But: Resource curse refers to the political and social consequences of country`s high dependence on resources` export. Dutch disease refers only to the effects of the resulting currency appreciation and changes in the cost of factors of production.
Dutch disease – theoretical model(Bruno and Sachs (1982); Corden and Neary (1982)) Spending effect Tradable resource (oil) sector Tradable (manufacturing) sector Non-traded sector (services) The resource movement effect What happens when world oil price goes up? The spending effect; The resource movement effect.
Dutch disease - outcome A result: A fall in the output share of non-natural resource tradables (manufacturing sector) relative to non-tradables (mostly service sector) and resource tradables (e.g. oil industry).
Is there any empirical evidence of Dutch Disease? Relatively robust evidence that terms of trade increases cause real exchange rate appreciation in natural-resource-rich countries (for example Spatafora and Warner 1995). Vostroknutova, Brahmbhatt, Canuto, VoxEU 2010.
Is there any empirical evidence of Dutch Disease? The shrinking of the manufacturing sector in response to terms of trade: mixed evidence (Sala-i-Martin and Subramanian 2003). Ismail (2010) finds strong evidence for Dutch Disease effects, with a 10% increase in an oil windfall/income associated with a 3.4% fall in value added across manufacturing sectors. On average in resource rich countries the tradables sector (manufacturing plus agriculture) is around 15% of GDP lower than the norm (Vostroknutova, Brahmbhatt, Canuto, VoxEU 2010).
Dutch Disease is good or bad for growth? Positive: -higher incomes and allowing more consumption of both non-tradables and tradables; -increased resources for investment in public goods. Negative: ForManufacturing -possess specific long-term, growth-enhancing qualities: positive technological spillovers, learning by doing effects, or increasing returns to scale in production. -more labour intensive than natural resource industries: implications for employment.
Dutchdisease and growth Theeffect for economicgrowth is inconlslusive. Negative: badinstitutions. Shocks that trigger foreign exchange inflows (such as natural resource booms, surges in foreign aid, remittances, or capital inflows) appreciate the real exchange rate, generate factor reallocation, and reduce manufacturing output and net exports. Real exchange rate misalignment due to overvaluation, and higher volatility of the real exchange rate, lower growth. There is actually no evidence in the literature that Dutch disease reduces overall economic growth.
The Dutch Disease and growth Motivated by the experiences of China and other East-Asian countries, a new literature based on the export-led growth strategy states that maintaining an undervalued or “competitive” real exchange rate may foster economic growth—where the operative channel is the size of the (manufacturing) tradable sector. In this view, while real exchange rate overvaluations hurt growth, undervaluations foster it. However, to show that DD reduces growth needs a strong assumption: that the manufacturing tradable sector is somehow “special.” Mostly, it has been assumed the existence of learning by doing or other types of externalities in this sector to obtain theoretical models linking DD with lower growth.
The Dutch Disease: Summary Upward swing in the world price of the export commodity/discovery of large resources deposits causes: • a large real appreciation in the currency. • an increase in spending (especially by the government). • an increase in the price of non-traded goods (goods and services such as housing that are not internationally traded), relative to traded goods (manufactures and other internationally traded goods other than the export commodity). • resultant shift of labor and land out of non-export-commodity traded goods. When crowded-out non-commodity tradable goods are in the manufacturing sector, the feared effect is deindustrialization.
Natural resourcesabundance and growth Economicgrowth Exports of primary products as a fraction of GDP
Global growth and commodityprices(de Souza VOX 2013) The most traumatic commodity price shocks can be found in the 1970s. The cumulative increases in global energy prices observed in 1973-1974 and 1979-1980 reached, respectively, around 200% and 100%. significant changes in global economic growth This negative correlation present during the 1970s to the mid-1980s seem to have changed after that period. Commodity price spikes have not been associated with similar growth slowdowns. If anything, the relationship would seem to be even slightly positive since the mid-1980s.
A rolling five-year correlation window between growth and commodity prices for the period 1970-2011 (de Souza VOX 2013)
Correlations between GDP growth and energy prices changes (de Souza VOX 2013)