Download
1 / 48
490 likes | 657 Views
SQL Server 2012 for Business Intelligence. UTS Short Course. Mehmet Ozdemir – SA @ SSW. w: blog.ozdemir.id.au | e: mehmet @ssw.com.au | t: @ mozdemir_au. SQL Server, BI, Infrastructure Specializes in Application architecture and design SQL Performance Tuning and Optimization

E N D
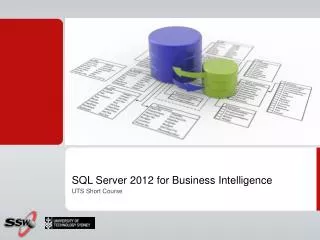
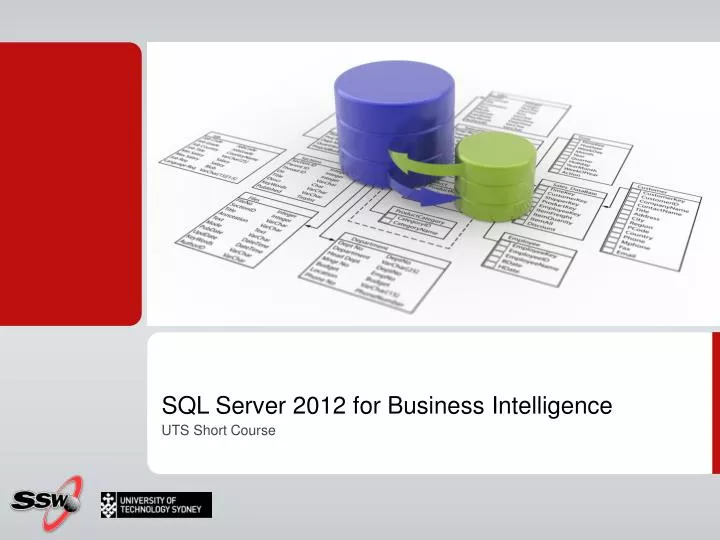
SQL Server 2012 for Business Intelligence UTS Short Course
Mehmet Ozdemir – SA @ SSW w: blog.ozdemir.id.au | e: mehmet@ssw.com.au | t: @mozdemir_au • SQL Server, BI, Infrastructure • Specializes in • Application architecture and design • SQL Performance Tuning and Optimization • HyperV, SCVMM • Technology aficionado • Virtualization • Reporting/BI • Cubes
Admin Stuff • Attendance • You initial sheet • Hands On Lab • You get me to initial sheet • Homework • Certificate • At end of 5 sessions • If I say if you have completed successfully
Course Website • http://sharepoint.ssw.com.au/Training/UTSSQL/Pages/default.aspx • Course Timetable • Course Materials
Recap • Reporting services • Building reports • Export to which formats? • Adding interactivity with ? • Building ad hoc reports • Tools to create and modify reports? • Processing • Local vs server side? • Report Administration • Creating scheduled reports • Performance - Caching • Security
Step by step to BI • Create Data Warehouse • Copy data to data warehouse • Create OLAP Cubes • Create Reports • Browse the cube • Do some Data Mining • Discovering a Relationship that was not obvious • Predict future events (e.g. targeting and forecasting)
New Excel 2013 Controls • New Excel controls via Prodiance integration for even better self service BI governance, controls and monitoring • Audit and Control Management Server • Discovery and Risk Assessment • SpreadsheetInquire • SpreadsheetCompare • Database Compare
Agenda • Power View: What it is and what you can do with it! • Power Pivot: What it is and what you can do with it! • Basics • Installation • Creating mash-ups • Designing PowerPivot reports • Extending with DAX • Publishing to SharePoint PowerPivotGallery • Other Cube browsers
Discover new Insights At The Speed Of Thought With PowerView • Explore, visualize and share insights with Power View • Interactive, browser-based, ad-hoc data exploration for gathering insights at the speed of thought • Rich data visualizations bar, line, pie and trellis charts, geo mapping and animations for identifying patterns and trends • Advanced filtering capabilities enable powerful What-If type analysis • Visual design experience • Presentation-ready
Excel 2013 PowerView Data Source • Data right within Excel 2013 can be a data source for Power View • When tables and relationships are added, Excel is creating an Excel Data Model behind the scenes • Optionally the Excel data model can be edited in PowerPivotin Excel for more sophisticated data model for Power View reports • You can also create Power View reports based on a tabular model running on a SQL Server 2012 Analysis Services (SSAS) server • Tabular and data models act as a bridge between the complexities of back-end data sources and your perspective of the data
Easily deploy fully interactive reports Drag and drop, user defined drill paths What-If type analysis with filtering Geospatial Mapping Save or export multiple views to SharePoint Wide variety of data visualizations
PowerPivot PowerPivot For Excel PowerPivot For SharePoint
PowerPivot Analyst Top 10 • Ability to work with massive data volumes in tens of millions • Mash ups (pivot tables) from multiple tables and a wide variety of data source types • 80+ contextual DAX measures, time intelligence, distinct count, and many other complex logical functions • PowerPivotRelationships in-memory, highly-scalable technology is so much faster than classic VLOOKUPs • World-class 5x, 10x and even 15x Data Compression • SharePoint PowerPivot Gallery and automated, scheduled data refresh • SharePoint PowerPivotself-service reporting data source • SharePoint PowerPivotusage and query source tracking • User friendly, configurable Slicers join multiple pivot charts and pivot tables for interactive dashboards • Minimal learning curve for experienced Excel users to easily develop creative and impactful analytic solutions
PowerPivot Massive Data Volumes • Empowers anyone to create, interactive self-service data mash ups from a variety of data sources • Up to 100x faster than VLOOKUP with high performance, in-memory technology • No longer limited to 65K or 1 million rows
Data Sources • Excel Worksheet Data • Databases: Relational or multidimensional • Microsoft SQL Server • Microsoft Access • Microsoft Analysis Services Cubes • Reports: Reporting Services data feeds • Data Feeds: Cloud, web service or other internet data source feeds • Text: Raw delimited text files • Other Data Sources: • Microsoft SQL Azure • Microsoft SQL Server Parallel Data Warehouse • Oracle, Teradata, Sybase, Informix, IBM DB2 • Others (OLE DB/ODBC) • Excel Files • SAP or SAP BW • https://datamarket.azure.com
Data Analysis Expressions (DAX) PARALLELPERIOD() PREVIOUSMONTH() PREVIOUSYEAR() NEXTMONTH() NEXTYEAR() DATESMTD() DATESQTD () DATESYTD () DISTINCT() FILTER() RELATED() … • PowerPivot contextual formula language for easy, advanced custom calculations • Over 80 additional functions designed to perform dynamic aggregation • Date and Time Functions • Filter Functions • Information Functions • Logical Functions • Mathematical and Trigonometric Functions • Statistical Functions • Text Functions • Time Intelligence Functions
Additional PowerPivot Features • Developed for BI use cases • Hierarchies / Parent Child dimensions • Multiple table relationships • Role playing dimensions • Date type table and Time Intelligence • KPIs • DAX server queries and language improvements • Rank, Top N, Switch and more • Many-to-many optimizations via DAX • Usability Enhancements • Relationship diagrams designer • Life-cycle upgrade for self-service BI to enterprise BI • Analyst > Power User > BI Developer • Restore Excel PowerPivot to BISM Server Model
Excel 2013 PowerPivot • Data model functionality now natively integrated into Excel 2013, no longer requires separate PowerPivot add-in • Excel automatically loads data into the xVelocity in-memory engine • Optional PowerPivot add-in for advanced modeling capabilities • Filter data when importing • Rename tables and columns as you import data in PowerPivot • Manage the model and create relationships with the Diagram View • Apply formatting for Power View and PivotTable reports) • Define calculated fields and advanced DAX calculations • Define key performance indicators (KPIs) • Create user-defined hierarchies • Define perspectives • Excel and PowerPivot now have a single, uniform Field List • New Data Discovery with Suggested Related Data
Common PowerPivot Applications • Personalized Excel and SharePoint Dashboards • Excel Reports, Reporting Services Report Builder and PerformancePoint Dashboards built on PowerPivot models • Power User mashes up and personalizes corporate data sets for team reporting model usage • Many data source types available!!! • Forecasting, Budgeting, What-If Analysis • Combining OLAP actuals with free form data scenarios • Unions of Excel files with same column structures to combine departmental inputs into one consolidated view • Surveys
PowerPivot Web Sites And Books • http://www.PowerPivot.com • http://powerpivot-info.com • http://powerpivotgeek.com • http://powerpivotpro.com • http://blogs.msdn.com/powerpivot • https://datamarket.azure.com
SharePoint 2010/2013 • Excel Services • PowerPivot via Excel 2013 • Reporting Services Integration (already in 2007) • Visio Services 2010 (Strategy Maps) • Access Services
Reporting Services Integration • Can run from • Local file (website or winform) • Reporting Services server • Publish into SharePoint • Scheduling and exporting to different formats • Interactive drill through • Great for Static Reports • E.g. Monthly Sales
Visio Services (Strategy Maps) • Publish Visio diagrams into SharePoint • View Visio diagrams through the browser without needing Visio to be installed • Data driven diagrams so you can pull information into your Visio diagrams • For more information see http://siddhumehta.blogspot.com/2010/02/strategy-maps-visio-services-2010.html
SQL Server 2012 • SQL Server 2012 Licensinghttp://download.microsoft.com/download/A/5/D/A5D112E1-78FF-491F-9364-F1BC6FAE7D57/SQL_Server_2012_Licensing_Datasheet_Nov2011.pdf • Data warehousing with SQL Server 2012http://www.microsoft.com/en-us/sqlserver/solutions-technologies/data-warehousing.aspx • TechNet Virtual Labs - Hands on Labshttp://technet.microsoft.com/it-it/cc164207(en-us).aspx
Power BI • Office 365 Subscription model • Cloud Hosted • Power BI Sites • Power Query • Power Pivot • Power View • Power Map
Power BI Demo • http://www.microsoft.com/en-us/powerBI/solutions/demo/business-demos.aspx#fbid=mSA1GjYzET4
Resources • Microsoft BI Products http://www.microsoft.com/en-us/bi/Products/Office.aspx • SSW Ruleshttp://www.ssw.com.au/ssw/Standards/Rules/RulesToBetterBusinessIntelligence.aspxhttp://www.ssw.com.au/ssw/Standards/betterSoftwareSuggestions/PerformancePoint.aspx
Summary • Overview • Excel reports to SSAS • Power View • Power Pivot • Extending with DAX • SharePoint deployments
3things… • mehmet@ssw.com.au • http://blog.ozdemir.id.au • twitter.com/mozdemir_au
Thank You! Gateway Court Suite 10 81 - 91 Military Road Neutral Bay, Sydney NSW 2089 AUSTRALIA ABN: 21 069 371 900 Phone: + 61 2 9953 3000 Fax: + 61 2 9953 3105 info@ssw.com.auwww.ssw.com.au http://blog.gfader.com/