Download
1 / 40
640 likes | 2.63k Views
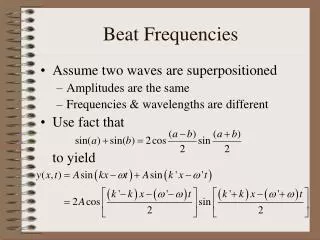
Given genotype frequencies, calculate allele frequencies in a gene pool !. Alleles = A, a Genotypes = AA, Aa, aa Frequency of allele A: f (A) = f (AA) + 1/2 f (Aa) Frequency of allele a: f (a) = f (aa) + 1/2 f (Aa). f(A) + f(a) = 1.0 p + q = 1.0 (allele frequencies)

E N D
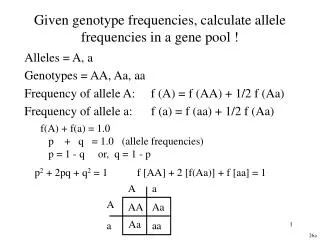
Given genotype frequencies, calculate allele frequencies in a gene pool ! Alleles = A, a Genotypes = AA, Aa, aa Frequency of allele A: f (A) = f (AA) + 1/2 f (Aa) Frequency of allele a: f (a) = f (aa) + 1/2 f (Aa) f(A) + f(a) = 1.0 p + q = 1.0 (allele frequencies) p = 1 - q or, q = 1 - p p2 + 2pq + q2 = 1 f [AA] + 2 [f(Aa)] + f [aa] = 1 A a A AA Aa Aa a aa 26a
Hardy-Weinberg Equilibrium Parental generation: 2 alleles, r and R f (R) + f (r) = 1.0 p + q = 1.0 p = 0.1, q = 0.9 In the next generation (F1): p2 + 2pq + q2 = 1 predicts allele freqs. F1 genotypeGenotypeAllele freq. p2 (.01) RR p = 0.01+.18/2= .1 q2 (.81)rr q = 0.81+.18/2 = .9 2pq (.18) Rr 27a-1
Hardy-Weinberg Equilibrium Parental allele frequencies p and q predict F1 generation genotype frequencies, by the formula p2 + 2pq + q2 = 1 Note: parental generation genotype frequencies do NOT predict F1 generation genotype frequencies!! 27a-2
Hardy-Weinberg Equilibrium Conclusions: 1)Allele frequencies are conserved (i.e., the same) from one generation to the next. 2) genotype frequency reaches Hardy-Weinberg equilibrium in one generation 27a-2
Hardy-Weinberg’s caveats: But • Hardy-Weinberg Law: allele frequencies in a population • remain constant from generation to generation ….. • IF random mating • IF all genotypes are equally viable • IF not disturbed by mutation, selection or whatever Only Bottom line: Only in an IDEAL population is genetic diversity conserved forever.
Sex = Random sampling of a gene pool Population of 10 individuals (N = 10) Phenotypes RedWhite Genotypes RR,Rr, rr Allele frequencies R = 0.6 r = 0.4 Parental gene pool 10 genotypes 20 alleles Parental gametes Probability of F1 r = .4; R =.6 R r r R R R R r r R r r R R R r R r R R 25A -1
F1 genotypes and phenotypes Genotype Frequency Phenotype Frequency Rr or rR .48 R_ .48+.36=.84 rr .16 rr .16 RR .36 --------------- = 1 ------------- = 1 25A -2
If allele frequencies are P and Q in the parental generation, how do we calculate what they will be in the F1 generation?
If allele frequencies are P and Q in the parental generation, how do we calculate what they will be in the F1 generation? Genotype frequencies in F1 are calculated by: p2 + 2pq + q2 = 1 From which we can calculate p and q for F1
If the fraction of the population with allele “A” at a given locus is .7, and the fraction of the population with “a” at the locus is .3, what will be the expected genotype frequencies in F1, , the next generation?
If the fraction of the population with allele “A” at a given locus is .7, and the fraction of the population with “a” at the locus is .3, what will be the expected genotype frequencies in the F1? Allele frequencies in P (parental generation): A = .7 = p a = .3 = q Expected genotypes and their frequencies in F1: AA = p2 = .49 aa = q2 = .09 Aa = 2pq = .42
What will be the expected phenotypes and their ratios in this example?
What will be the expected phenotypes and their ratios in this example? Allele frequencies in P (parental generation): A = .7 = p a = .3 = q Expected genotypes in F1: AA = p2 = .49 aa = q2 = .09 Aa = 2pq = .42 Expected phenotypes in F1: A‑ = .49 + .42 = .91 aa = .09
Heterozygosity defined H = % heterozygous genotypes for a particular locus = % heterozygous individuals for a particular locus = probability that a given individual randomly selected from the population will be heterozygous at a given locus 29f
H = ? Aa aa aa AA aa aA aa AA aA AA aa aa AA aa aA H = 4/15
Heterozygosity defined H (“H-bar”) = average heterozygosity for all loci in a population. H estimated = % heterozygous loci those examined H = 2pq 29f
Calculating H (assuming simple dominance and Hardy-Weinberg Eq.) calculate H if q2 = 0.09 f (a) = 0.3 = q q2 = 0.09 f (A) = 0.7 = p p2 = 0.49 2 pq = 0.42 H = 2pq = 0.42 (for only 2 alleles) 29a - 1
Calculating H (but if……) Codominance Genotype Phenotype N AA Red 50 Aa Pink 22 aa White 10 total = 82 H = 22/82 (don’t need Hardy - Weinberg) 29a - 1
Calculating H for 3 alleles: p, q, r p q p = 0.5 q = 0.4 r = 0.1 H = 2pq + 2qr + 2pr = .40 + .08 + .10 = .58 r pp pq p pr qq q pq qr r pr qr rr 29a
1% of golden lion tamarins have diaphragmatic hernias, a condition expressed only in the homozygous recessive genotype. Calculate the number of heterozygous individuals in the wild population (N = 508). Assume Hardy-Weinberg equilibrium and simple dominance. Genotypes: AA Aa aa F1 generation p2 = ? = f (AA) 2pq = ? = f (Aa) = H q2 = .01 = f (aa) 29ez - 1
q2 = .01 q = = 0.1 p + q = 1 so p = 1 - q p = 1 - .1 = .9 H = 2pq = 2 x .9 x .1 = 0.18 Nheterozygous = .18 x 508 = 91 29ez - 2
H and P H = heterozygosity = the percent of heterozygous genotypes in the population for that locus H = 2pq (for 2 allele case) H = 2pq + 2qr + 2 pr (for 3 allele case) P = allelic diversity = percent polymorphism = percent of loci for which alternative alleles exist in the population 29A
Gene pools Population 1 N = 8 (7 homozygous) 2N = 16 alleles f (blue) = 1/16 f (red) = 15/16 Population 2 N = 8 2N = 16 alleles f (blue) = 16/16 Polymorphic locus Monomorphic locus typical population P = approximately 0.25 individual H = approximately 0.07 5f
The relationship of P to H Possible alleles = a, b, c aa bb ab ab cc ac ac ac H = 1/4 H = 4/4 N alleles = 3 N alleles = 3 Conclusion: H is not sensitive to the number of different alleles for the locus. 30f
Population A, locus X alleles frequency a .5 b .5 H = 2pq = .50 P is low Population B, locus X alleles frequency a .7 b .05 c .05 d .05 e .05 f .05 g .05 H = .495, P is high The relationship of H to P 30A
Uses of molecular genetics* in conservation 1) Parentage and kinship 2) Within-population genetic variability 3) Population structure and intraspecific phylogeny 4) Species boundaries, hybridization phenomena, and forensics 5) Species’ phylogenies and macroevolution *e.g., electrophoresis protein sequencing DNA fingerprinting immunological techniques 15 -2
Western Pyrénées National Park, France From Encarta
Effective population size N = population size = total number of individuals Ne = effective population size = ideal population size that would have a rate of decrease in H equal to that of the actual population (N) number of individuals contributing gametes to the next generation 32A-1
Effective population size Predictable loss of heterozygosity (H) in each generation for non-ideal populations GLT Ne = .32 N; N = 100, Ne = 32 Loss of H(N) = loss of H (Ne) If Ne/N 1, then rate of loss of H is minimum. The larger the Ne, the lower the rate of loss of H. 1 Rate of loss of H defined: 2Ne per generation 32b
Examples of effective population size Taxon Ne Drosophila .48 to .71 N Humans .69 to .95 N a snail species .75 N plants lower golden lion tamarins .32 N (94 of 290) 32A-2
Assumptions of an ideal population • Infinitely large population • random mating • no mutation • no selection • no migration 31a -1
5 causes of microevolution 1) genetic drift - stochastic variation in inheritance Expected F2: 9 - 3 - 3 - 1 Observed F2: 9 - 3 - 2.8 - 1.2 2) Assortative (nonrandom) mating 3) Mutation 4) Natural selection 5) Migration (gene flow) Random deviation 31a-2
Sampling Error F1 allele frequencies = Parental allele frequencies Caused by, for example: Behavioral traits producing assortative mating Genetic stochasticity Results in Genetic Drift = random deviation from expected allele frequencies 34A-2
Fixation of alleles Fn fixed Parental generation for many populations A = 1.0 a = 0 lost A = .5 a = .5 Genetic drift p = 1.0 lost A = 0 a = 1.0 p = q = .5 fragmentation fixed q = 1.0 time 34A-1
What is a formula for calculating the effect of unequal numbers of males and females (non-random breeding)on Ne? Ne = 4 MF M = # of breeding males M + F F = # of breeding females Population A Population B M = 50 M = 10 F = 50 F = 90 N = 100 Ne = 4 x 50 x 50 = 4 x 10 x 90 50 + 50 10 + 90 = 100 = 36 10f
The effect of non-random mating on H Given 2 cases, with N = 150 and Ne = 100 (population A) Ne = 36 (population B) Ht=1 = 1 - 1 Ht = the proportion of heterozygosity 2 Ne remaining in the next (t=1) generation Population A: Ht = 1 - 1 = 1 - .005 = .995 2 x 100 Population B: Ht = 1 - 1 = 1 - .014 = .986 2 x 36 * % H remaining after t=1 generations 36A-1
Generalized equation: Ht = H0 1 - 1 t t = # of generations later 2Ne H0 = original heterozygosity What is H after 5 more generations? Population A: H5 = H0 (.995) 5 = .995 (.995)5 = .970 Population B: H5 = H0 (.986) 5 = .995 (.986)5 = .919 * 36A-2
Formulae for calculating H and Ne 1 = proportion of H0 lost at each generation 2Ne 1 - 1 = proportion of H0 remaining after the first generation 2 Ne Ht = H0 1 - 1 t = the absolute amount of H0 remaining after 2Ne t generations Ne = 4 MF 1) unequal sex ratios or M + F 2) nonrandom breeding decrease Ne 37A
Mutation Nondisjunctive point mutations over short term: not important in changing allele frequencies f (A1) = 0.5 mutation rate A1 --> A2 = 1 105 over 2000 generations, f (A1) = 0.49 If f (A2) increases rapidly, selection must be involved Long-term, over evolutionary time mutation is critical - providing raw material for natural selection Mutation rate is independent of H, P, Ne but mutation can increase H and increase P 36A1