Download

1 / 50
510 likes | 667 Views
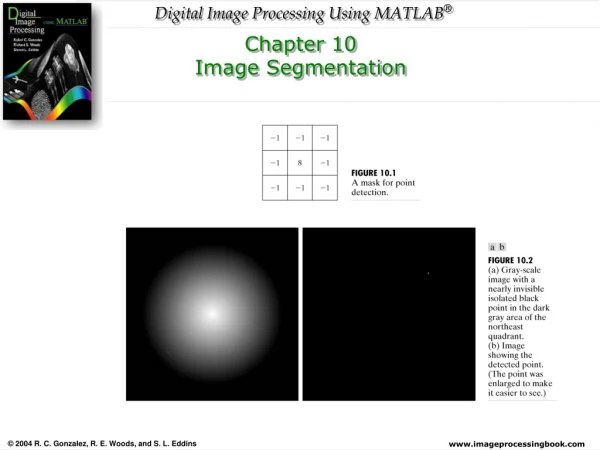
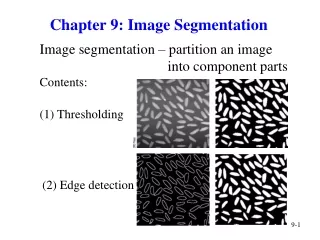
Chapter 5 Segmentation. Read: Szeliski Chapter 5. Image Segmentation. Many approaches proposed Early techniques: region splitting or merging Recent algorithms: global criterion Intra-region consistency and inter-region boundary lengths or dissimilarity Active contour Level sets

E N D
Chapter 5 Segmentation Read: Szeliski Chapter 5
Image Segmentation • Many approaches proposed • Early techniques: region splitting or merging • Recent algorithms: global criterion • Intra-region consistency and inter-region boundary lengths or dissimilarity • Active contour • Level sets • Normalized cuts • Markov random fields
Image Segmentation • Many approaches proposed • cues: color, regions, contours • automatic vs. user-guided • no clear winner • Experimental comparison • Berkeley Segmentation Dataset and Benchmark • Database of foreground and background segmentations http://www.eecs.berkeley.edu/Research/Projects/CS/vision/grouping/segbench/ http://www.wisdom.weizmann.ac.il/vision/Seg Evaluation DB/index.html
Intelligent Scissors [Mortensen 95] • Approach answers a basic question • Q: how to find a path from seed to mouse that follows object boundary as closely as possible?
Intelligent Scissors • Basic Idea • Define edge score for each pixel • edge pixels have low cost • Find lowest cost path from seed to mouse mouse seed • Questions • How to define costs? • How to find the path?
Path Search (basic idea) • Graph Search Algorithm • Computes minimum cost path from seed to allotherpixels
How does this really work? • Treat the image as a graph q c p • Graph • node for every pixel p • link between every adjacent pair of pixels, p,q • cost c for each link • Note: each link has a cost • this is a little different than the figure before where each pixel had a cost
Defining the costs • Treat the image as a graph q c p Want to hug image edges: how to define cost of a link? • the link should follow the intensity edge • want intensity to change rapidly ┴ to the link • c - |difference of intensity ┴ to link|
Defining the costs • c can be computed using a cross-correlation filter • assume it is centered at p • Also typically scale c by its length • set c = (max-|filter response|) • where max = maximum |filter response| over all pixels in the image q c p
1 1 w -1 -1 Defining the costs • c can be computed using a cross-correlation filter • assume it is centered at p • Also typically scale c by its length • set c = (max-|filter response|) • where max = maximum |filter response| over all pixels in the image q c p
9 4 5 1 3 3 3 2 Dijkstra’s shortest path algorithm link cost 0 • Algorithm • init node costs to , set p = seed point, cost(p) = 0 • expand p as follows: • for each of p’s neighbors q that are not expanded • set cost(q) = min( cost(p) + cpq, cost(q))
9 4 5 1 3 3 3 2 Dijkstra’s shortest path algorithm 4 9 5 1 1 1 0 3 3 2 3 • Algorithm • init node costs to , set p = seed point, cost(p) = 0 • expand p as follows: • for each of p’s neighbors q that are not expanded • set cost(q) = min( cost(p) + cpq, cost(q) ) • if q’s cost changed, make q point back to p • put q on the ACTIVE list (if not already there)
9 4 5 1 3 3 3 2 Dijkstra’s shortest path algorithm 4 9 5 2 3 5 2 1 1 0 3 3 3 4 3 2 3 • Algorithm • init node costs to , set p = seed point, cost(p) = 0 • expand p as follows: • for each of p’s neighbors q that are not expanded • set cost(q) = min( cost(p) + cpq, cost(q) ) • if q’s cost changed, make q point back to p • put q on the ACTIVE list (if not already there) • set r = node with minimum cost on the ACTIVE list • repeat Step 2 for p = r
9 4 5 1 3 3 3 2 Dijkstra’s shortest path algorithm 4 3 6 5 2 3 5 3 2 1 1 0 3 3 3 4 4 3 2 3 • Algorithm • init node costs to , set p = seed point, cost(p) = 0 • expand p as follows: • for each of p’s neighbors q that are not expanded • set cost(q) = min( cost(p) + cpq, cost(q) ) • if q’s cost changed, make q point back to p • put q on the ACTIVE list (if not already there) • set r = node with minimum cost on the ACTIVE list • repeat Step 2 for p = r
Dijkstra’s shortest path algorithm • Properties • It computes the minimum cost path from the seed to every node in the graph. This set of minimum paths is represented as a tree • Running time, with N pixels: • O(N2) time if you use an active list • O(N log N) if you use an active priority queue (heap) • takes fraction of a second for a typical (640x480) image • Once this tree is computed once, we can extract the optimal path from any point to the seed in O(N) time. • it runs in real time as the mouse moves
5.1 Active Contours • Curves: object boundaries • Intelligent scissors • sketch in real time a curve that clings to object boundaries • Snakes • energy-minimizing, 2D spline curve that evolves towards image features such as strong edges • Level set • Evolve the curve as the zero-set of a characteristic function, • Easily change topology and incorporate region-based statistics
5.1.1 Snakes • Global optimization, energy minimization Weighting function for first- and second-order continuity while controlling the tears and creases respectively
5.1.1 Snakes • Energy-minimizing splines • Image-based, constraint-based potentials • line: attracts the snake to dark ridges • edge: attracts the snake to strong gradients (edges) • term: attracts the snake to line terminations Internal spline energy
5.1.1 Snakes • In practice, most systems only use the edge term • Image gradients or • Smoothed Laplacian • Interactive applications: user-placed constraints • Anchor points d(i) • Repulsive forces 1/r
5.1.1 Snakes • Lip tracking Kass, M., Witkin, A., and Terzopoulos, D. (1988). Snakes: Active contour models
5.1.1 Snakes • Regular snakes have a tendency to shrink, it is better to initialize them drawing the snake outside the object of interest to be tracked • An expansion ballooning force, essentially moving each point outwards along its normal • Solve sparse linear system, Dynamic programming • More efficient or interactive algorithm like intelligent scissors and GrabCut
5.1.1 Snakes • Roughly specify a boundary of interest and have the system evolve the contour towards a more accurate location as well as track it over time. • Unpredictable • May require additional user-based hints
5.1.3 Scissors • Optimizing the contour in real time while user drawing • Clings to high-contrast edges (Mortensen and Barrett 1995)
5.1.3 Scissors • Simple way: snapping the current mouse position to the nearest likely boundary point • Compute lowest-cost path between the starting seed point and the current mouse location • Pre-processed to associate low cost with edges that are likely to be boundary elements • Computing lowest cost using Dijkstra’s algorithm (breadth-first dynamic programming algorithm) (Gleicher 1995)
5.1.3 Scissors • To avoid jumping around unpredictably, the system will freeze the curve to date after a period of inactivity • To present jumping onto adjacent higher-contrast contours, the system learns the intensity profile under the current optimized curve to preferentially keep the wire moving along the similar looking boundary
5.1.3 Scissors • Several extensions • Tobogganing • a simple form of watershed region segmentation, pre-segment the image onto regions whose boundaries become candidates for optimized curve paths • Region boundaries are turned into a smaller graph, nodes are located wherever three or four regions meet • Use Dijkstra algorithm, much faster and more stable performance • JetStream • Use a probabilistic framework to take the current trajectory of the boundary in to account Mortensen and Barrett (1999) (P´erez, Blake, and Gangnet 2001)
5.1.4 Level Sets • Parametric curves with the form of f(s) • Hard to change the topology of the curve • If the shape changes dramatically, curve reparameterization may also be required • Level sets for closed contours • Zero-crossing(s) of a characteristic function define the curve • Fit and track objects of interest by modifying the underlying embedding function instead of the curve f(s) • A small strip around the locations of the current zero-crossing needs to updated at each step Fast Marching Methods
5.1.4 Level Sets • Geodesic Active Contour Caselles, Kimmel, and Sapiro (1997) and Yezzi, Kichenassamy, Kumar et al. (1997) a generalized version of the snake edge potential
5.1.4 Level Sets • Geodesic Active Contour Caselles, Kimmel, and Sapiro (1997) and Yezzi, Kichenassamy, Kumar et al. (1997) Moves the curve in the direction of its curvature, i.e. it acts to straighten the curve Moves the curve in the down the gradient of g(I), encourage the curve to migrate towards minima of g(I)
5.1.4 Level Sets • Easily change the topology • Local minima based on local measurement (gradient, …) • Energy to measure the consistency of image statistics inside and outside the segmented regions • Color, texture, motion • More information • Osher and Paragios (2003), Paragios, Faugeras, Chan et al. (2005), Paragios and Sgallari (2009)
5.1.4 Level Sets Grayscale image Energy measures the consistency of the image statistics inside and outside the regions Color image Cremers, Rousson, and Deriche 2007
Applications: Contour Tracking and Rotoscoping • Track facial features for performance-driven animation • Track heads and people, moving vehicles • Medical image segmentation (CT image) • Rotoscoping Agarwala, Hertzmann, Seitz et al. (2004)
5.2 Split and Merge • Simplest method: select a threshold and compute the connected components • Single threshold is rarely sufficient for the whole image because of lighting and intra-object statistical variations original image dilation erosion majority opening closing Morphology
5.2 Split and Merge • A number of algorithms • Recursively splitting the whole image into pieces based on region statistics • Merging pixels and regions together in a hierarchical fashion • Combine both splitting and merging by starting with a medium-grain segmentationand then allowing merging and splitting operations
5.2.1 Watershed • Catchment basins: • treating an image as a height field or landscape, regions where the rain would flow into the same lake • Start flooding from local minima, and label ridges wherever differently evolving components meet
5.2.2 Region Splitting (Divisive Clustering) • Splitting the image into successively finer regions is one of the oldest techniques • Splitting the image iteratively by finding thresholds that best separates the large peaks in the histogram • Recent splitting algorithms • Optimize some metric of intra-region similarity and inter-region dissimilarity. • GraphCut, Normalized Cut…
5.2.3 Region Merging (Agglomerative Clustering) • Data clustering • Based on distance between their closest points (single-link clustering), farthest points (complete-link clustering) or something in between • Superpixels • Pixel-based merging --- combines adjacent regions whose average color difference is blow a threshold or whose regions are too small • Not semantically meaningful, but useful pre-processing for higher-level algorithms (Jain, Topchy, Law et al. 2004) (Mori, Ren, Efros et al. 2004)
5.2.4 Graph-based Segmentation • Relative dissimilarity between regions to determine which ones should be merged • Optimizes a global grouping metric • Pixel to pixel dissimilarity measure • For any region R, its internal difference is • Two adjacent regions, the difference between regions is Minimum spanning tree
5.2.4 Graph-based Segmentation • Merges two adjacent regions whose difference is smaller than the minimum internal difference of R1, R2 • Merge regions in decreasing order of edges separating them • Produce segmentations that are neither too fine nor too coarse • Fixed-size pixel neighborhoods, running time O(NlogN), N=pixel number, the fastest segmentation algorithms : a heuristic region penalty
5.2.4 Graph-based Segmentation • (Felzenszwalb and Huttenlocher 2004) (a) input grayscale image that is successfully segmented into three regions even though the variation inside the smaller rectangle is larger than the variation across the middle edge; (b) input grayscale image; (c) resulting segmentation using an N8 pixel neighborhood.
5.2.5 Probabilistic Segmentation Alpert, Galun, Basri et al. (2007) • Two cues: gray-level similarity and texture similarity • Regions • Difference in average intensities between : • Minimal external difference from other neighboring regions • Average intensity difference is the boundary length between regions R_i and R_k
5.2.5 Probabilistic Segmentation Alpert, Galun, Basri et al. (2007) • Two cues: gray-level similarity and texture similarity • Regions • Texture similarity: • Relative differences between histogram bins of simple oriented Sobel filter responses • Likelihood that two regions should be merged using
5.2.5 Probabilistic Segmentation Alpert, Galun, Basri et al. (2007) • Merging proceeds in a hierarchical fashion • A subset of the nodes that are strongly coupled to all of the original nodes (regions) are used to define the problem at a coarser scale for each • Recursively compute the statistics in coarser scale