Download
1 / 20
200 likes | 443 Views
Demographics of Diversity. EDSE 3204. Activity. Group membership Goal: try to group yourself among other classmates according to the similar icon placed on your back. You may NOT speak or make any type of sound to give hints You may NOT pull the icon off your back

E N D
Demographics of Diversity EDSE 3204
Activity Group membership Goal: try to group yourself among other classmates according to the similar icon placed on your back. You may NOT speak or make any type of sound to give hints You may NOT pull the icon off your back Basically you need to communicate with others on how to form specific groups without seeing what is on your back
LET’S TALK • How did you feel being part of a group? • How did you know that you belonged to a particular group of people? • How did you feel not being part of the group? • Everyone in class think of a time when you felt like you didn’t belong. What were the circumstances and how did you deal with it?
Continue Discussion • Think about a time when someone treated you as if you could not do something. How did you feel about that person and yourself? How did you behave around him or her?
Next Question • In your small group: Discuss times when your stereotypes about deficits and about who can and cannot learn have been challenged. What are some strategies for challenging negative generalizations about intelligence? Make a list of these strategies
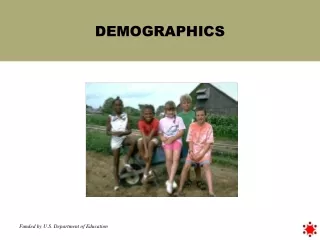
Diverse Society • By 2010, whites will account for 9% of world’s population • Among school children, 37% are nonwhite • There are 215 nations in the world, people from every one of them live in the U.S. • Poverty is not decreasing in the cities, but is increasing in the suburbs • By the first few decades of 2000, there will be more Hispanic children than African Am.
Poverty • Approximately 29.3% African Am., 30.3% Hispanic compared to 11% Caucasian live below poverty levels • The relationship between poverty and children’s educational achievement is mediated by parent level of education and NOT RACE
Free and Reduced Lunch • 40% of students in Duluth qualify • Family of 4 earning $20,650 a year or less are living in poverty • Children living in a family of 4 whose parents make $26,845 or less qualify for FRL • Children living in a family of 4 whose parents make $38,203 qualify to receive lunch at a reduced rate
Poverty Continued • Low-wealth children engage in far less academic work • By Oct. of first grade, a middle/high-SES child reads 12 words per reading session; a low-SES child reads 0 words • By April, the middle/high-SES child reads 81 words; a low-SES child reads 32 words • By the end of first grade, middle/high-SES have seen approximately 19,000 words; low-SES about 10,000 • By the end of the sixth grade, a child of poverty would need to go to school an additional year-and-a-half to have the same academicexperience
Poverty Continued • 20% live in single-parent homes • 40% will live with divorced parents before the age of 18 • 14% are at risk of dropping out of school • African Am. Youth drop out rate is 16.3%, Hispanic youth is 33.9% • Each day, 40 teenagers give birth to their 3rd child
District Totals • 10,128 students in district • 4,018 receive free and reduced lunch • 40% of students receive free and reduced lunch • 40% students who receive FRL are considered proficient in math • 54% students who receive FRL are considered proficient in reading
Issues in Special Education Placement • Does the child have a disability or come from a culturally different background? • Does the language barrier prevent the learning? • What about the unfavorable stigma in special education? • What are the parents beliefs regarding special education? • What about self-fulfilling prophecy?
Percentage of Students Served by Disability and Race-Ethnicity 1999-2000 U.S. Department of Education (2001). Twenty-third annual report to congress on the implementation of the Individuals with Disabilities Act. Washington, DC: Author
Wrap Up • At your table discuss which of the disabilities included in IDEA could be considered “invisible”? What might be the impact of having a disability that was “invisible” as compared to one that is “visible”?