Download

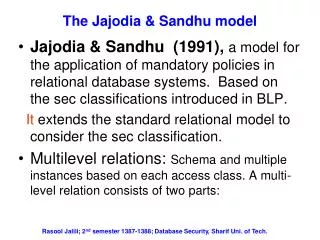
1 / 45
450 likes | 676 Views
Model Identification & Model Selection. With focus on Mark/Recapture Studies. Overview. Basic inference from an evidentialist perspective Model selection tools for mark/recapture AICc & SIC/BIC Overdispersed data Model set size Multimodel inference. DATA.

E N D
Model Identification & Model Selection With focus on Mark/Recapture Studies
Overview • Basic inference from an evidentialist perspective • Model selection tools for mark/recapture • AICc & SIC/BIC • Overdispersed data • Model set size • Multimodel inference
DATA /* 01 */ 1100000000000000 1 1 1.16 27.7 4.19; /* 04 */ 1011000000000000 1 0 1.16 26.4 4.39; /* 05 */ 1011000000000000 1 1 1.08 26.7 4.04; /* 06 */ 1010000000000000 1 0 1.12 26.2 4.27; /* 07 */ 1010000000000000 1 1 1.14 27.7 4.11; /* 08 */ 1010110000000000 1 1 1.20 28.3 4.24; /* 09 */ 1010000000000000 1 1 1.10 26.4 4.17; /* 10 */ 1010110000000000 1 1 1.42 27.0 5.26; /* 11 */ 1010000000000000 1 1 1.12 27.2 4.12; /* 12 */ 1010101100000000 1 1 1.11 27.1 4.10; /* 13 */ 1010101100000000 1 0 1.07 26.8 3.99; /* 14 */ 1010101100000000 1 0 0.94 25.2 3.73; /* 15 */ 1010101100000000 1 0 1.24 27.1 4.58; /* 16 */ 1010101100000000 1 0 1.12 26.5 4.23; /* 17 */ 1010101000000000 1 1 1.34 27.5 4.87; /* 18 */ 1010101011000000 1 0 1.01 27.2 3.71; /* 19 */ 1010101011000000 1 0 1.04 27.0 3.85; /* 20 */ 1010101000000000 1 1 1.25 27.6 4.53; /* 21 */ 1010101011000000 1 0 1.20 27.6 4.35; /* 22 */ 1010101011000000 1 0 1.28 27.0 4.74; /* 23 */ 1010101010110000 1 0 1.25 27.2 4.59; /* 24 */ 1010101010110000 1 0 1.09 27.5 3.96; /* 25 */ 1010101010110000 1 1 1.05 27.5 3.82; /* 26 */ 1010101010101100 1 0 1.04 25.5 4.08; /* 27 */ 1010101010101010 1 0 1.13 26.8 4.22; /* 28 */ 1010101010101010 1 1 1.32 28.5 4.63; /* 29 */ 1010101010101010 1 0 1.18 25.9 4.56; /* 30 */ 1010101010101010 1 0 1.07 26.7 4.01; /* 31 */ 1010101010101010 1 1 1.26 26.9 4.68; /* 32 */ 1010101010101010 1 0 1.27 27.6 4.60; /* 33 */ 1010101010101010 1 0 1.08 26.0 4.15; /* 34 */ 1010101010101010 1 1 1.11 27.0 4.11; /* 35 */ 1010101010101010 1 0 1.15 27.1 4.24; /* 36 */ 1010101010101010 1 0 1.03 26.5 3.89; /* 37 */ 1010101010101010 1 0 1.16 27.5 4.22;
Models carry the meaning in science • Model • Organized thought • Parameterized Model • Organized thought connected to reality
Science is a cyclic process of model reconstruction and model reevaluation • Comparison of predictions with observations/data • Relative comparisons are evidence
All models are false, but some are useful. George Box
Statistical Inferences • Quantitative measures of the validity and utility of models • Social control on the behavior of scientists
Scientific Model Selection Criteria • Illuminating • Communicable • Defensible • Transferable
Statistical Methods are Tools • All statistical methods exist in the mind only, but some are useful. • Mark Taper
Classes of Inference • Frequentist Statistics - Bayesian Statistics • Error Statistics – Evidential Stats – Bayesian Stats
Two key frequencies in frequentist statistics • Frequency definition of probability • Frequency of error in a decision rule
Null H tests with Fisherian P-values • Single model only • P-value= Prob of discrepancy at least as great as observed by chance. • Not terribly useful for model selection
Neyman-Pearson Tests • 2 models • Null model test along a maximally sensitive axis. • Binary response: Accept Null or reject Null • Size of test (α) describes frequency of rejecting null in error. • Not about the data, it is about the test. • You support your decision because you have made it with a reliable procedure. • N-P test tell you very little about relative support for alternative models.
Decisions vs. Conclusions • Decision based inference reasonable within a regulatory framework. • Not so appropriate for science • John Tukey(1960) advocated seeking to reach conclusions not making decisions. • Accumulate evidence until a conclusion is very strongly supported. • Treat as true. • Revise if new evidence contradicts.
In conclusion framework, multiple statistical metrics not “incompatible” All are tools for aiding scientific thought
Statistical Evidence • Data based estimate of the relative distance between two models and “truth”
Common Evidence Functions • Likelihood ratios • Differences in information criteria • Others available • E.g. Log(Jackknife prediction likelihood ratio)
Model Adequacy • Bruce Lindsay • The discrepancy of a model from truth • Truth represented by an empirical distribution function, • A model is “adequate” if the estimated discrepancy is less than some arbitrary but meaningful level.
Model Adequacy and Goodness of Fit • Estimation framework rather than testing framework • Confidence intervals rather than testing • Rejection of “true model formalism”
Model Adequacy, Goodness of Fit, and Evidence • Adequacy does not explicitly compare models • Implicit comparison • Model adequacy interpretable as bound on strength of evidence for any better model • Unifies Model Adequacy and Evidence in a common framework
Model adequacy interpreted as a bound on evidence for a possibly better model Empirical Distribution - “Truth” Model 1 Potentially better model Model adequacy measure Evidence measure
Goodness of fit misnomer • Badness of fit measures & goodness of fit tests • Comparison of model to a nonparametric estimate of true distribution. • G2-Statistic • Helinger Distance • Pearson χ2 • Neymanχ2
Points of interest • Badness of fit is the scope for improvement • Evidence for one model relative to another model is the difference of badness of fit.
ΔIC estimates differences of Kullback-Leibler Discrepancies • ΔIC = log(likelihood ratio) when # of parameters are equal • Complexity penalty is a bias correction to adjust of increase in apparent precision with an increase in # parameters.
Evidence Scales Note cutoff are arbitrary and vary with scale
Which Information Criterion? • AIC? AICc ? SIC/BIC? • Don’t use AIC • 5.9 of one versus 6.1 of the other
What is sample size for complexity penalty? • Mark/Recapture based on multinomial likelihoods • Observation is a capture history not a session
To Q or not to Q? • IC based model selection assumes a good model in set. • Over-dispersion is common in Mark/Recapture data • Don’t have a good model in set • Due to lack of independence of observations • Parameter estimate bias generally not influenced • But fit will appear too good! • Model selection will choose more highly parameterized models than appropriate
Quasi likelihood approach • χ2 goodness of fit test for most general model • If reject H0 estimate variance inflation • c^ = χ2 /df • Correct fit component of IC & redo selection
Problems with Quasilikelihood correction • C^ is essentially a variance estimate. • Variance estimates unstable without a lot of data • lnL/c^ is a ratio statistic • Ratio statistics highly unstable if the uncertainty in the denominator is not trivial • Unlike AICc, bias correction is estimated. • Estimating a bias correction inflates variance!
Fixes • Explicitly include random component in model • Then redo model selection • Bootstrapped median c^ • Model selection with Jackknifed prediction likelihood
Large or small model sets? • Problem: Model Selection Bias • When # of models large relative to data size some models will have a good fit just by chance • Small • Burnham & Anderson strongly advocate small model sets representing well thought out science • Large model sets = “data dredging” • Large • The science may not be mature • Small model sets may risk missing important factors
Model Selection from Many Candidates Taper(2004) SIC(x) = -2In(L) + (In(n) + x)k.
Performance of SIC(X) with small data set. N=50, true covariates=10, spurious covariates=30, all models of order <=20, 1.141 X 10¹⁴ candidate models '
Chen & Chen 2009 • M subset size, P= # of possible terms
Explicit Tradeoff • Small model sets • Allows exploration of fine structure and small effects • Risks missing unanticipated large effects • Large model sets • Will catch unknown large effects • Will miss fine structure • Large or small model sets is a principled choice that data analysts should make based on their background knowledge and needs
Akaike Weights & Model Averaging Beware, there be dragons here!
Akaike Weights • “Relative likelihood of model i given the data and model set” • “Weight of evidence that model i most appropriate given data and model set”
Model Averaging • “Conditional” Variance • Conditional on selected model • “Unconditional” Variance. • Actually conditional on entire model set
Good impulse with Huge Problems • I do not recommend Akaike weights • I do not recommend model averaging in this fashion • Importance of good models is diminished by adding bad models • Location of average influenced by adding redundant models
Model Redundancy • Model Space is not filled uniformly • Models tend to be developed in highly redundant clusters. • Some points in model space allow few models • Some points allow many
Redundant models do not add much information Model adequacy Model adequacy Model dimension Model dimension
A more reasonable approach • Bootstrap Data • Fit model set & select best model • Estimate derived parameter θ from best model • Accumulate θ Repeat Within Time Constraints Mean or median θ with percentile confidence intervals