Download
1 / 28
280 likes | 291 Views
Explore empirical estimates of demand for medical care, the RAND Health Insurance Experiment, and interpreting regression results on abortion demand.

E N D
Demand for Medical ServicesPart 2 Health EconomicsProfessor Vivian HoFall 2007 These notes draw from material in Santerre & Neun, Health Economics, Theories, Insights and Industry Studies. Thomson 2004
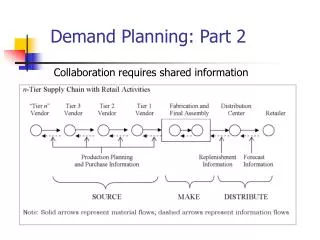
Outline • Empirical estimates of demand from the literature • Practice problems • The RAND Health Insurance Experiment • Example: Interpreting results from a regression on abortion demand
Estimating Demand for Medical Care • Quantity demanded = f( … ) • out-of-pocket price • real income • time costs • prices of substitutes and complements • tastes and preferences • profile • state of health • quality of care
Empirical Evidence • Demand for primary care services (prevention, early detection, & treatment of disease) has been found to be price inelastic • Estimates tend to be in the -.1 to -.7 range • A 10% in the out-of-pocket price of hospital or physician services leads to a 1 to 7% decrease in quantity demanded • Ceteris paribus, total expenditures on hospital and physician services increase with a greater out-of-pocket price
Empirical Evidence (cont.) • Demand for other types of medical care is slightly more price elastic than demand for primary care • Consumers should be more price sensitive as the portion of the bill paid out of pocket increases
Out-of-Pocket Payments in the U.S. • Hypothesis: Consumers are more price sensitive if they pay a larger % of the health care bill • The fall in the % of out-of-pocket payments may explain the rapid rise in health care costs
Out-of-Pocket Payments in the U.S. Total Expenditures and % Paid Out-of-Pocket, 2004 • Hypothesis: Consumers are more price sensitive if they pay a larger % of the health care bill • Higher hospital and physician expenditures may be due to the low % paid out-of-pocket
Out-of-Pocket Payments in the U.S. (cont.) • The previous 2 slides argue that: insurance coverage expenditures • But it may be the opposite: expenditures insurance coverage. • We cannot identify a causal effect using just this data
Empirical Evidence (cont.) • Studies which have examined price and quantity variation within service types have found that: • The price elasticity of demand for dental services for females is -.5 to -.7 • The own-price elasticity of demand for nursing home services is between -.73 and -2.4
Empirical Evidence (cont.) • At the individual level, the income elasticity of demand for medical services is below +1.0 • The travel time elasticity of demand is almost as large as the own-price elasticity of demand • Little consensus on whether hospital care and ambulatory physician services are substitutes or complements
Regression Analysis • Sample - developed countries Ln(Real per capita Ln(Real per = a + b + e health expenditures) capita income) • Estimates of b range between 1.13 and 1.31 International Estimates of Income Elasticity • Are health care expenditures destined to consume a larger portion of GDP as GDP grows?
Applying Demand Theory to Real Data • Demand analyses in health care must take insurance into account • Demand analyses are critical in shaping managerial and public policy decisions
The Rand Health Insurance Experiment • A large, social science experiment to study individuals’ medical care under insurance • A large sample of families were provided differing levels of health insurance coverage • Researchers then studied their subsequent health care use
The Sample • 5,809 individuals, under 65 • 6 sites (Dayton OH, Seattle WA, Fitchburg MA, Charlston SC, Georgetown County SC, Franklin County MA) • 1974 – 1977 • Cost : $80 million
Insurance Plans in the Experiment 1. Free fee-for-service (FFS). - i.e., no coinsurance 2. 25% copayment per physician visit 3. 50% copayment per physician visit 4. 95% copayment per physician visit
Insurance Plans in the Experiment 5. Individual deductible - $150 deductible for physician visits; all subsequent visits free 6. HMO - Not the same as free fee-for-service - Since HMO receives a fixed annual fee, it seeks to limit physician visits
Table 3.3. Sample Means for Annual Use of Medical Services per Capita Plans* Face-to- Outpatient Inpatient Total Probability Face Visits Expenses Dollars Expenses Using Any (1984 $) (1984 $) (1984 $)Medical Service Free 4.55 340 409 749 86.8 25% 3.33 260 373 634 78.8 50% 3.03 224 450 674 77.2 95% 2.73 203 315 518 67.7 Individual deductible 3.02 235 373 608 72.3 * The chi-square test was used to test the null hypothesis of no difference among the five plan means. In each instance, the chi-square statistic was significant to at least 5 percent level. The only exception was for inpatient dollars Source : Willard G. Manning et al. “Health Insurance and the Demand for Medical Care : Evidence from a Randomized Experiment,” American Economic Review 77 (June 1987), Table 2
As coinsurance ‘s, probability of ANY use ‘s Results (cont.) • No statistically significant difference in inpatient (hospital) expenses by insurance type • Does NOT necessarily imply inelastic demand for hospital services • Experiment included $1,000 cap on out-of-pocket medical expenses; 70% of hospital admissions costs $1,000 +
Own Price Elasticity of Demand All Care Outpatient Care Copay 0-25% - 0.10 - 0.13 Copay 25-95% - 0.14 - 0.21 Results (cont.) • As consumers’ copayments drop, demand for medical care becomes more price inelastic • The data confirms the theory
Free fee-for-service (FFS) versus HMO coverage • No difference in physician visits found • But only 7.1% of HMO patients admitted to hospital, versus 11.2% of FFS patients Results (cont.) • HMO patients cost 30% less than FFS patients on average • HMO’s do save money relative to FFS
What are the implications for health outcomes? • i.e restraining medical care expenditures is not the only objective we care about, especially for the poor • The experiment verifies that coinsurance • demand for medical care Health Implications
Health Implications (cont.) • Poor adults (lowest 20% of income distribution) with high blood pressure experienced clinically significant improvement under free FFS plan, but not in cost sharing plan • Similar findings for myopia, dental health • Free FFS only improves health outcomes in 3 specific cases versus cost-sharing • If want to restrain costs and maintain health, targeted programs at these 3 health problems is more cost-effective than free care for all services
In the next 2 years, # of insurance companies with first-dollar coinsurance for hospital care increased from 30% to 63% • # of insurance companies w/ annual deductible of $200 + per person ‘d from 4% to 21% • Estimated cost saving from ‘d demand for medical care = $7 billion Was it worth it? • Rand Health Insurance Experiment cost $80 million • Initial results published in 1981 • Government sponsored studies often yield important knowledge for business
Economically Objective Data on Abortion • Is the choice of abortion responsive to economic factors? • Medoff ( 1988) • Sample : state-level data from 1980 • Model the demand for abortion as a function of price and other relevant factors
An Economic Analysis of the Demand for Abortion (Medoff, 1988) A = - 207.780 - 0.924P + 0.031Y + 4.194SNGL + 4.456LFP (1.41) (3.22) (3.31) (1.74) (2.57) + 18.287W + 1.207CATH + 43.775M (1.74) (1.50) (2.12) R2 = .77 N = 50 Where : A = Number of abortion per 1,000 pregnancies of women of childbearing age (15-45) P = Price of an abortion Y = Average income SNGL = Percentage of woman who are single LFP = Labor force participant rate W = Dummy variable to control for women in western states CATH = Percentage of Catholic population in each state M = Dummy variable to control for states that provide Medicaid funding of abortions
Price effect is negative and statistically significant • Implied price of elasticity of demand = - 0.81 • If abortion price ‘s 50%, demand for abortions would 40.5% Economically Objective Data on Abortion • Income variable positive and statistically significant • Implied income elasticity of demand = 0.79
Medicaid funding strongly ‘s demand for abortions Economically Objective Data on Abortion (cont.) • SNGL and LFP positive and statistically significant • Single and working women have higher opportunity cost of time from raising children
Conclusions • Our economic model of demand provides hypotheses that we can test with real data • Although it is difficult to measure the quantity of medical services demanded and economic variables, both price and income effects are important determinants of the demand for medical care