Download
1 / 46
460 likes | 950 Views
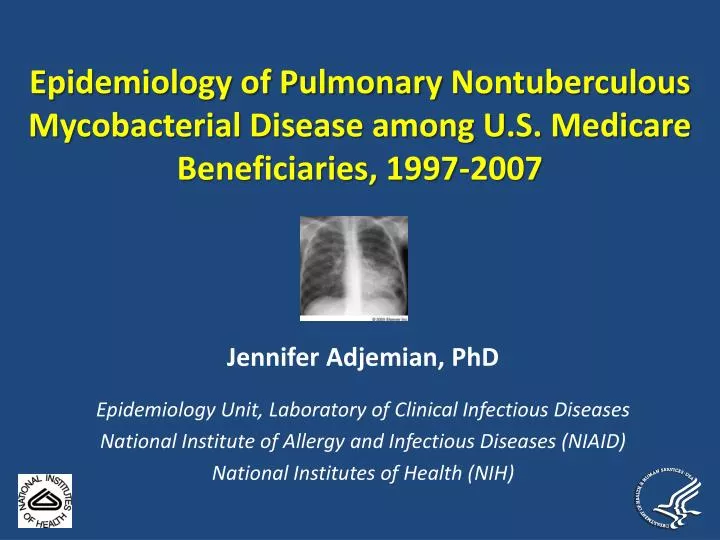
Epidemiology of Pulmonary Nontuberculous Mycobacterial Disease among U.S. Medicare Beneficiaries, 1997-2007. Jennifer Adjemian, PhD Epidemiology Unit, Laboratory of Clinical Infectious Diseases National Institute of Allergy and Infectious Diseases ( NIAID)

E N D
Epidemiology of Pulmonary Nontuberculous Mycobacterial Disease among U.S. Medicare Beneficiaries, 1997-2007 Jennifer Adjemian, PhD Epidemiology Unit, Laboratory of Clinical Infectious Diseases National Institute of Allergy and Infectious Diseases (NIAID) National Institutes of Health (NIH)
Nontuberculous Mycobacteria (NTM) • Diverse group of small bacilli • Over 140 species identified • Widely distributed in the environment • Species vary by geographic area • Soil and water (natural and treated) sources • Biofilms lining pipes for drinking water
NTM Exposure and Infection • People infected from environmental exposures • Hard to identify exact source of infection • NTM species range greatly in human pathogenicity • Most human infections in U.S. from: • M. aviumcomplex (MAC) (water, soil, animals) • M. kansasii(tap water) • M. abcessus(more common in SE U.S.) • M. chelonae(keratitis cases from contact lenses/LASIK) • M. fortuitum (water, soil; salon whirlpool footbaths)
NTM Infection & Disease • Ranges from asymptomatic infection to severe illness • Infection can manifest in the: • Lymphatic system • Skin/soft tissue/bone • Disseminated • Lungs (80%) • Treatment involves multiple antibiotics over extended period of time
NTM Lung Disease • Commonly presents as chronic pulmonary disease • Symptoms: • Chronic or recurring cough (with or without blood) • Sputum production • Fatigue • Shortness of breath • Chest pain • Weight loss • Often accompanied by coexisting lung diseases • Bronchiectasis,COPD, and cystic fibrosis
PNTM Prevalence Estimates • National prevalence estimates are limited • Not a reportable disease • Estimates vary by location, age and year • 1.8/100,000 to 57/100,000 • Trends observed • Increasing prevalence over time • Older age groups (average age ~70 yrs) • White females (≥ 60%), especially with low BMI
Need for National PNTM Prevalence Estimates • National estimates needed: • To determine true public health burden of NTM • To identify most affected segments of US population • To identify risk factors for disease
Study Objective • To identify the prevalence and trends of NTM lung disease in adults ≥ 65 yrs throughout US
Data Compilation • Data from 5% sample of Medicare Part B enrollees from 1997-2007 • Exclusion criteria: • <65 yrs old, covered by an HMO, enrolled for <1 month, or resided outside US • Data collected on: • Demographics (sex, race/ethnicity, age, location) • ICD-9 codes associated with claims • Scanned for Pulmonary NTM (PNTM) – 031.0
Prevalence Estimates • Annual prevalence (AP) for each year and period prevalence (PP) for total time period (1997-2007) • Stratified by sex, race/ethnicity, age group, state of residence, geographic region • Annual percent change (APC) • Poisson regression models used to evaluate significant changes in prevalence over time
Risk Factor Analysis • Univariate logistic regression used to evaluate associations between PNTM and demographic factors
Results: Population Summary • 2.3 million individuals included from 5% sample • Represents ~4% of all US adults ≥ 65 years old • Demographics similar to general population
PNTM Cases • 2,548 PNTM cases identified from 1997-2007 • 65% female, 90% white, and ranged 65-98 yrs old • From all 50 states and DC • 1/3 from the southeastern US • > 50% of cases from 8 states: CA, FL, TX, NY, PA, IL, NC, GA • 13 states averaged < 1 case/yr; ND only reported 1 case
U.S. Distribution of NTM Lung Disease Cases in Adults ≥ 65 years of age
Period Prevalence (PP) from 1997-2007 • PP was 112 (95% CI: 108-116) cases /100,000 persons • Significantly higher among women than men • 127 vs. 93 cases / 100,000 persons • Varied by geographic location and race/ethnicity
PP of PNTM by State CA: 191 AZ: 179 LA: 178 MS: 165 FL: 176 HI: 396
Annual Prevalence (AP) • Avg AP of 31/100,000 persons per yr • Increased significantly by 8.2% per yr
Discussion • First study to provide nationally representative estimates of PNTM disease in older adults throughout the US and across various racial/ethnic groups • Prevalence of PNTM is increasing significantly across all regions of the US and among both men and women • ICD-9 codes likely underestimate prevalence
Increasing Prevalence of PNTM Disease • Recent shift from middle-aged male smokers to older women without known risk factors • Increasing segment of US population • Improved diagnostics and testing, however increases noted worldwide and throughout various points in time • Greater concentration in drinking water • Resistant to disinfectants and chlorination
Race/Ethnicity and PNTM Disease • PNTM cases were predominantly white women, but Asians/Pacific Islander men seem to be at greater risk • Role of race/ethnicity complex and is likely driven by behavioral, cultural, and biological/genetic factors • In Japanese population, PNTM associated with certain alleles of human leukocyte antigen markers • Pacific Islanders more likely than Asian Americans to be smokers, overweight, and have higher chronic disease and mortality rates despite no differences in access to care
Geographic Differences in Prevalence • Hawaii had highest prevalence • ~ ½ Asian/Pacific Islander PNTM cases resided in HI, but still had ↑est PP even when they were excluded, suggesting environmental in Hawaii may also contribute • Higher prevalence in SE and West is consistent with prior reports of higher human exposure • ↑ #s of NTM isolated from coastal swamps of SE • NTM most often isolated from CF patients at study sites in southern Louisiana and also California
Conclusions • High risk groups and areas likely due to complex interactions among environmental and host factors • With prevalence rising throughout US, clinicians must increase awareness of those at high risk for NTM • More studies needed to better understand complex relationships between host and environment • Prospective epidemiologic case-control studies • Spatial epidemiologic analyses evaluating environmental factors associated with cases on a finer scale
Acknowledgements • Support for this study was provided by the LCID, NIAID, NIH, especially: • Kenneth Olivier, MD • Amy E. Seitz, MPH • Steven M. Holland, MD • Rebecca Prevots, PhD, MPH
Results: PP by Region • Highest in western states (149/100,000 ) • > 1/3 of cases from Southeast (131/100,000) • Lowest PP in Midwest (78/100,000 ) West Midwest Northeast Southwest Southeast
Results: Medical Claims Analysis • 16,508 records with pulmonary NTM-related claim • 64% as primary claim • 22% as secondary claim • 11% as tertiary claim • 4% as quaternary claim • 75% had pulmonary NTM as primary claim at least once • 6.5 pulmonary NTM claims submitted on avg per case
Annual prevalence of PNTM cases among a sample of U.S. Medicare Part B enrollees by sex from 1997-2007
Results: Age Distribution of NTM Cases Average Annual % of Enrollees and Cases by Age Group
Results: Multivariate Logistic Regression *Significant interaction detected; †Controlled for confounding by COPD and Bronchiectasis
Estimating Disease Prevalence through U.S. Medicare Data • Centers for Medicare and Medicaid’s Carrier Standard Analytic File (SAF) • 5% sample of all medical claims submitted for individuals enrolled in Medicare Part B (~44 million) • Final action claims data from non-institutional providers • i.e. physicians, independent clinical laboratories, ambulance providers, and stand-alone ambulatory surgical centers • Claims include primary ICD-9 code and up to 3 additional codes for other conditions associated with the claim • Representative of U.S. population ≥ 65 yrs
Mortality Analysis • PNTM cases: • 35% overall all-cause mortality rate • 40% more likely to die than non-cases (OR=1.4 [1.3-1.6]) • Among PNTM cases, risk of death greater in: • Men (OR=1.8 [1.6-2.2]) relative to women • Blacks (OR=2.1 [1.4-3.1]) and Hispanics (OR=2.4 [1.2-4.7]) relative to whites • Those with ≥ 3 comorbidities (OR=1.3 [1.0-1.6]) • Those also diagnosed with lung cancer (OR=1.7 [1.4-2.1], asthma (OR=1.7 [1.1-2.7]) or pneumonia (OR=2.9 [2.3-3.6])
Diagnosis with NTM Lung Disease • Clinical/Radiologic • Pulmonary symptoms, nodular/cavitary opacities on chest radiograph,or high-resolution computed tomography (HRCT) scan showing multifocal bronchiectasis with multiplenodules • Appropriate exclusion of other diagnoses. (i.e. TB) • Microbiologic • Pos. culture on ≥ 2 separate sputum samples • Pos. culture on ≥ 1 bronchialwash orlavage • Transbronchial or other lung biopsy withmycobacterial histopathologicfeatures
Annual Percent Change (APC) • Overall APC of 8.2% (95% CI: 7.2-9.2) per year
Comorbidity Analysis * Prevalence of COPD likely overestimated due to issues associated with Medicare claims coding
Prevalence of selected comorbidities among male and female PNTM cases
Comorbidities in PNTM Cases • Significantly more likely to be diagnosed with other and greater #s of comorbidities than non-cases • Almost all PNTM cases were diagnosed with at least one other lung-associated condition • All prevalence estimates for PNTM and comorbidities are limited to accuracy of ICD-9 code reporting