Download
1 / 46
460 likes | 568 Views
Stellar Evolution. Stars form from cool clouds of gas called molecular clouds Gravity overcomes pressure, and several stars begin to form Usually get multiple stars in the same region, about the same age Called clusters Initially, the stars are all moving together at the same speed

E N D
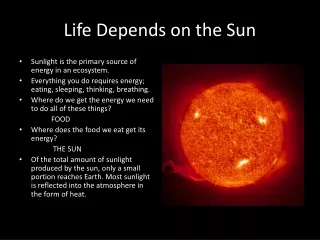
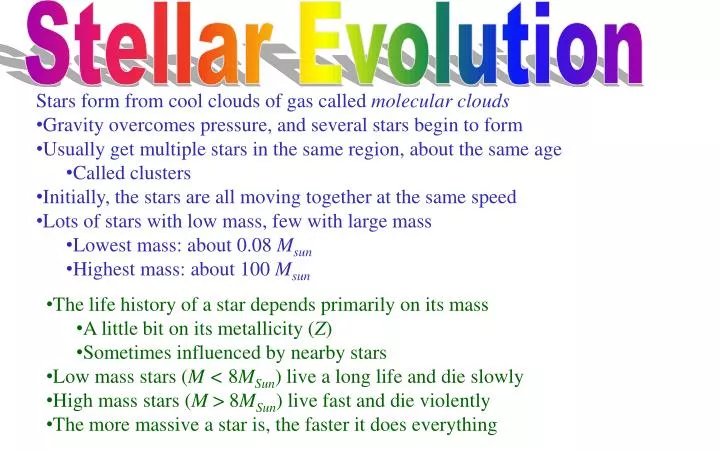
Stellar Evolution • Stars form from cool clouds of gas called molecular clouds • Gravity overcomes pressure, and several stars begin to form • Usually get multiple stars in the same region, about the same age • Called clusters • Initially, the stars are all moving together at the same speed • Lots of stars with low mass, few with large mass • Lowest mass: about 0.08 Msun • Highest mass: about 100 Msun • The life history of a star depends primarily on its mass • A little bit on its metallicity (Z) • Sometimes influenced by nearby stars • Low mass stars (M < 8MSun) live a long life and die slowly • High mass stars (M > 8MSun) live fast and die violently • The more massive a star is, the faster it does everything
Stellar Evolution Molecular Clouds Protostar Main Sequence Star Red Giant star Horizontal Branch Asymptotic Giant Branch Planetary Nebula White Dwarf Low Mass Stars M < 8MSun High Mass Stars M > 8MSun Protostar Main Sequence Star Supergiant Stages Type II Supernova Neutron Star or Black Hole • Stars are powered by nuclear fusion • The combining of simple nuclei to make more complex ones • Stages are defined by what is going on at the center
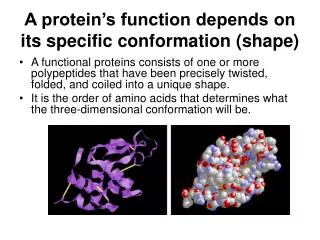
Main Sequence Stars: Introduction • A Main Sequence Star is a star that is burning hydrogen to helium at its center • This is nuclear burning, not combustion • No oxygen • We don’t care about the details • This process is extremely efficient • It can go for a long time • During this stage, the structureof the star hardly changes • Small increase inluminosity • Spectral classstays almost thesame • Small motionupwards in theH-R diagram 4 1H 4He
Main Sequence Stars: Mass Dependance Type Mass O5 60 B0 18 B5 5.9 A0 2.9 A5 2.0 F0 1.6 F5 1.3 G0 1.05 G5 .92 K0 .85 K5 .74 M0 .51 M5 .21 M8 .06 • Everything about the star depends on mass • Higher mass stars have: • Larger radius • Somewhat higher temperature • Much higher luminosity 60 MSun 1 MSun • The main sequence is a band because • Stars have variable metallicity • Stars are different ages 0.08 MSun
Main Sequence Stars: Lifetime • A star stays as a main sequence star until it runs out of hydrogen • The amount of fuel is proportional to its mass: • The rate it consumes fuel depends on its mass: • How long it lasts depends on mass: The Sun lasts about 10 Gyr on main sequence Big Stars Die Fast
Giant Stars Molecular Clouds Protostar Main Sequence Star Red Giant star Horizontal Branch Asymptotic Giant Branch Planetary Nebula White Dwarf Low Mass Stars M < 8MSun High Mass Stars M > 8MSun Protostar Main Sequence Star Supergiant Stages Type II Supernova Neutron Star or Black Hole • The stars run out of hydrogen to burn to helium • Low mass stars burn helium to produce carbon and oxygen (Z = 6, 8) • High mass stars also produce elements through iron (Z = 26) • These produce much less energy than hydrogen • The fuel is used faster and runs out faster • All giant stages together last about 10% of the previous stages
Giant Stages: Movement on HR diagram • Low mass stars get cooler and more luminous • Up and right on the HR diagram • High mass stars get cooler • Right on the HR diagram • The high mass stars move off from the main sequence first • You can estimate the age of a cluster by which stars have left the main sequence • The turn off point • More about this later
Announcements ASSIGNMENTS DayHomeworkRead TodayHwk. E Cepheid Variable Stars, Type Ia Supernovae FridayHwk. F Geometric Distance Methods MondayHwk. G Standard Candle Distance Methods 2/3
Cepheid Variable Stars • Not all stars are constant luminosity • There is a region of the HR diagram where stars pulsate, called the instability strip • Not Main Sequence stars • The temperature, size, and luminosity all vary periodically • Many Cepheids are extremely bright - much more luminous than typical main sequence stars • We can see them far away, even in nearby galaxies • One of the biggest motivations for the Hubble telescope was to study Cepheids in galaxies a few Mpc away
Cepheid Variable Stars • Bigger stars pulsate more slowly • Bigger stars are more luminous • There is a simple relationship between the period and the luminosity • If you know the period, you know the luminosity • If you measure the brightness, you can then get the distance • Complication – modified by metallicity • Must be compensated for P is period in days
Planetary Nebula Molecular Clouds Protostar Main Sequence Star Red Giant star Horizontal Branch Asymptotic Giant Branch Planetary Nebula White Dwarf Low Mass Stars M < 8MSun High Mass Stars M > 8MSun Protostar Main Sequence Star Supergiant Stages Type II Supernova Neutron Star or Black Hole • Low Mass stars end their lives as planetary nebulas • Outer layer is expelled from the star • This mixes carbon/oxygen/helium back into interstellar space • Inner super-hot layer gradually revealed • This star is now radiating in the ultraviolet – visible luminosity is low • But the ultraviolet light excites the atoms in the gas that has been expelled
Asymptotic Giant Planetary Nebula White Dwarf Ultraviolet Hydrogen Helium Carbon/Oxygen
Helix Dumbbell Ring M2-9 Cat’s Eye
Hourglass Eskimo NGC 6751
Distance Methods • Geometric Distance Methods: • Radar Distancing • Parallax • Moving Cluster Method • Light Echo Method • Standard Candle Distance Methods: • Spectroscopic Parallax • Cluster Fitting • Planetary Nebula Luminosity Function • Cepheid Variable Stars • Type Ia Supernovas • Hubble’s Law • Geometric distance methods rely on fundamental relationships between sizes, angles, etc. • Standard Candle distance methods rely on objects that are believed to be consistently the same luminosity • The methods are sometimes described as a ladder • You have to use the low rungs to get the higher rungs • Some rungs are sturdier than others
Radar Distancing • Radio waves move at the speed of light c • If separation of two planets is d,then the time to see the signal is: • Can only be used within the solar system • Reliability limited only by the accuracy with which we measure time • Essentially no error • This allows us to know the AU with high precision: d
Small Angle Formula • Most astronomical objects are so far away, they look small • Even though they aren’t! • For such small objects, there is a simple relationship between size, distance, and angular size s d • An exact relation depends on the exact geometry • An approximate relation does not • Make sure angle is in radians • For angles smaller than 1 degree, this works great
Parallax (1) • We use our two eyes to judge distances using a technique called parallax p1 p2 • The difference between the angle seen by each of the eyes is called the parallax • It is limited by baseline, how far apart the two points you measure from are • You can use the orbit of the Earth as a baseline p p
Parallax (2) • To understand what you will see, easiest to think of system as if Earth is still and star is moving in a circle: • If you view it from the edge, it looks like a straight line • If you view it from the bottom or top, it looks like a circle • If you view it from an angle, it looks like an ellipse. • The angular semi-major axis of this ellipse is the parallax • The other size depends on its ecliptic latitude • The actual size of the ellipse is 1 AU • It’s really the Earth’s orbit • We can determine distance: p sin p • This combination is called a parallax-second or parsec
Proper Motion • Why it’s not that simple: • Actual paths of stars are more complicated • Because the stars are also actually moving (relative to us)! • The average motion over many years is causing the apparent position of the star to change • If we know the distance, we can measure the tangential velocity
Sample Problem At right is plotted a star’s variation in position in the sky in x (red) and y (green) over a three year period in milliarcseconds. The red curve corresponds to the major axis of parallax. What is the: Angular velocity of proper motion, xand y (b) Angular speed of proper motion (c) Parallax in mas and distance in pc (d) Transverse speed vt
The Moving Cluster Method • A cluster of stars is a group of stars born from a single cloud of gas • It appears as a group of closely spaced stars • In general, they will all be born with approximately the same velocity • They are all moving together • If the cluster is moving away from you, there will be a vanishing point where they appear to be converging to a vanishing point • The vanishing point is where they end up at t = • It is the actual direction they are moving • We don’t have to wait this long to see where they are going • It’s where the projected paths intersect • Now, for any given star, measure vr, , and To vanishing point v vt =vsin Vanishing point vr =vcos
The Light Echo Method • Consider a very bright source of light that turns on suddenly • Like a supernova • The bright ring is probably a circle centered on thesupernova • It looks like an oval because it is probably tiltedcompared to our point of view • We can determine angle of tilt from the shape SN 1987a Centered ring of gas 2R 2R cos Other gas rings? 2R d • The light from the supernova comes straight to us at the speed of light • From the ring, it takes longer: • From it must first go to the leading edge of the ring • Then it must come from the leading edge to our eyes • We can measure the difference in time
The Light Echo Method (2) SN 1987a • We can now find the actual size of the object Centered ring of gas • We can also measure the angular size of the object • Note many methods give distances only to very specific objects • But many objects clearly are together • Probably at comparable distances • Measuring distance to one object gives you all such distances • SN 1987a was in the Larger Magellenic Cloud Other gas rings?
Standard Candles • A Standard Candle is any object that is consistently the same luminosity • The luminosity is normally converted to an absolute magnitude M • We can generally measure the apparent magnitude m • We can then determine the distance d: • To use standard candles, we must: • Establish that they are standard candles, i.e., show that they have consistently the same luminosity • Calibrate the luminosity of one or a few representative members • Determine its distance d by some other method • Measure the brightness / apparent magnitude m • Find M from our distance formulas • Complications: • There is often some spread in M: • Either introduces error or must be compensated for • Any dust between us and a source will change m • Can be indirectly measured by comparing different filters
Spectroscopic Parallax: • Uses main sequence stars • These are 90% of all stars, so not a restriction • Has nothing to do with parallax • Study many nearby main sequence stars • Get their distances by parallax • Measure their apparent magnitudes m • Deduce their absolute magnitudes M • Make a Hertzsprung Russell Diagram • Now, to measure the distance to any M.S. star: • Measure the apparent magnitude m • Measure the spectral class (color) • Use H-R diagram to deduce the absolute magnitude M • Find the distance using
Sample Problem: An F5 main sequence star has an apparent magnitude of m = 14.6. What is its distance?
Problems with Spectroscopic Parallax: • Main sequence stars are not exceptionally bright • You can’t see them at vast distances • Must use other methods • The main sequence is a band, not a line • Metallicity varies signficantly • Can be measured in the spectrum and compensated for • Age varies significantly • Difficult to compensate for with a single star • Use clusters!
Clusters: • A cluster of stars is a group of stars born from a single cloud of gas • It appears as a group of closely spaced stars • A cluster diagram is a Hertzsprung Russell diagram showing all the stars in a cluster • Recall: • Stars are “born” as Main Sequence Stars • Massive stars are the hot luminous ones • The most massive stars die first • Over time, the cluster diagram will change:
1 Million years old • At 1 million years old: • Some stars aren’t even main sequence yet • The brightest stars, though rare, dominate the light • O and B stars • Blueish tint to the cluster The Sun
10 Million Years • At 10 million years old: • Almost all stars are now main sequence • Some of the heaviest are in their supergiant phases • The transition determines the turnoff point • Some of them have died • B and A stars dominate • Blue/white tint to cluster Turnoff
30 Million Years • At 30 million years old: • More stars are supergiants • Turnoff point has moved • Mix of stars now • White color to cluster Turnoff
200 Million Years • At 200 million years old: • Red giants, horizontal branch, and asymptotic giants • Turnoff point moved farther • Yellow tint to cluster Turnoff
2 Billion Years • At 2 billion years old: • G, K, M stars dominate • Yellow/orange tint to cluster Turnoff
10 Billion Years • At 10 billion years old: • K, M stars dominate • Red tint to cluster • Sun is about to turn off Turnoff
The turn off point: • You can gauge the age of a collection of stars from the turn off point • The color is also an indication • Blueish: young • Reddish: old
The turn off point: • You can gauge the age of a collection of stars from the turn off point • The color is also an indication • Blueish: young • Reddish: old
Cluster Fitting • Spectroscopic parallax on steroids • Applies to clusters of stars • Many stars with similar composition and magnituded • Plot the apparent magnitude vs. spectral type • Measure composition – metallicity • Build a computer model predicting what a set of stars would look like with this composition • Plot the absolute magnitude vs. spectral type • Age the computer generated stars until the graph has the same shape • Turn off point tells you when to stop • Compare the absolute magnitude of the result with the apparent magnitude of the actual cluster • Find the distance from M m - M m O5 B5 A5 F5 G5 K5 M5
Cluster Fitting • Advantages • More accurate than spectroscopic parallax • Statistics of many stars helps eliminate errors • Disadvantages • Relies heavily on main sequence stars • These stars are relatively dim • Cannot be used beyond our galaxy
Planetary Nebula Luminosity Function • Planetary nebulas come in a variety of luminosities • But the distribution seems to be almost independent of where they come from • Very little dependence on the metallicity • The maximum luminosity can be determined from nearby planetary nebulae: • Find an object with several (many?) planetary nebulas • Make a histogram of number vs. apparent magnitude • Fit to curve – determine maximum brightness m* • Find the distance • Advantages • Can see these brighter objects at larger distances • Disadvantages • They aren’t that bright • You can only get distance to large objects – like galaxies
Cepheid Variable Stars • In their giant stages, certain stars begin to pulsate • Known as Cepheid Variable Stars • The bigger the star is, the slower its pulsation • The bigger the star is, the more luminous it is • There is a relationship between the period and the luminosity/absolute magnitude P is period in days • Measure the period of a pulsating Cepheid variable star • Use this formula to determine the maximum absolute magnitude M • Measure its apparent magnitude m • Determine the distance from
Cepheid Variable Stars • Advantages • Quite accurate method • Bright, comparable to planetary nebulas • You only need one • Disadvantages • Still somewhat rare stars – clusters or bigger only • Metallicity changes the relationship • Most stars near us (type I) have high metallicity • Some stars have much lower metallicity • Must be compensated for
Type Ia Supernovae • All type Ia supernovae are approximately 1.4 MSunwhite dwarfs that blow up the same way. • They should all have the same maximum luminosity • Find a type Ia supernovae where you want it • Measure its maximum apparent brightness m • Find the distance using: • Disadvantages • They aren’t really standard candles: • There is a spread in the maximum magnitude • There is an experimental correlation between how fast they fade and their maximum magnitude • Can be used to compensate for this problem • They are very rare – difficult to calibrate • Advantages • Quite accurate method • Spectacularly bright • Mixed: • So far away, other effects become important • Relativistic speeds, curvature of universe
Individual Conservation Laws: • Sometimes, you can consider a star in isolation • This only makes sense if the rest of the galaxy is (statistically) in a steady state • Treat a single star as if it is reacting under the gravity of all the other stars “smoothed out” • Fails if it undergoes a close encounter with another star • Motion is governed by potential from the whole galaxy* • Momentum is not conserved • Energy is conserved* • Angular momentum is harder: • If the object is spherically symmetric, angular momentum is conserved* • If it is axisymmetric, angular momentum around that axis is conserved* • If it has no symmetry, angular momentum not conserved *Provided no close encounters