Download
1 / 1
10 likes | 245 Views
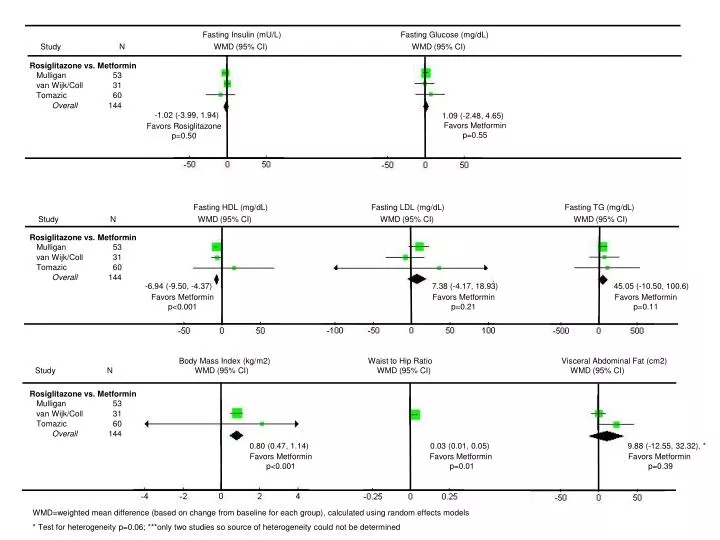
Fasting Insulin (mU/L) Fasting Glucose (mg/dL) Study N WMD (95% CI) WMD (95% CI). Rosiglitazone vs. Metformin Mulligan 53 van Wijk/Coll 31 Tomazic 60 Overall 144. -1.02 (-3.99, 1.94). 1.09 (-2.48, 4.65).

E N D
Fasting Insulin (mU/L) Fasting Glucose (mg/dL) Study N WMD (95% CI) WMD (95% CI) Rosiglitazone vs. Metformin Mulligan 53 van Wijk/Coll 31 Tomazic 60 Overall 144 -1.02 (-3.99, 1.94) 1.09 (-2.48, 4.65) Favors Metforminp=0.55 Favors Rosiglitazone p=0.50 Fasting HDL (mg/dL) Fasting LDL (mg/dL) Fasting TG (mg/dL) Study N WMD (95% CI) WMD (95% CI) WMD (95% CI) Rosiglitazone vs. Metformin Mulligan 53 van Wijk/Coll 31 Tomazic 60 Overall 144 -6.94 (-9.50, -4.37) 7.38 (-4.17, 18.93) 45.05 (-10.50, 100.6) Favors Metforminp<0.001 Favors Metforminp=0.21 Favors Metforminp=0.11 Body Mass Index (kg/m2) Waist to Hip Ratio Visceral Abdominal Fat (cm2) Study N WMD (95% CI) WMD (95% CI) WMD (95% CI) Rosiglitazone vs. Metformin Mulligan 53 van Wijk/Coll 31 Tomazic 60 Overall 144 0.80 (0.47, 1.14) 0.03 (0.01, 0.05) 9.88 (-12.55, 32.32), * Favors Metforminp<0.001 Favors Metformin p=0.01 Favors Metformin p=0.39 WMD=weighted mean difference (based on change from baseline for each group), calculated using random effects models * Test for heterogeneity p=0.06; ***only two studies so source of heterogeneity could not be determined