Download

1 / 17
180 likes | 474 Views
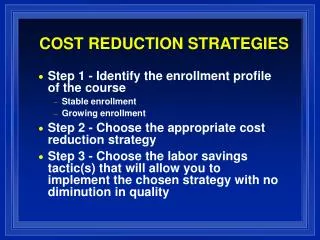
Enterprise Cost Reduction. Transforming the Cost Structure for Sustained Benefits. Based on a recent cross-industry survey of 250 global C-suite and board-level executives, cost reduction has become essential, with more than 85% of respondents citing it as a key issue in their business.

E N D
Enterprise Cost Reduction Transforming the Cost Structure for Sustained Benefits
Based on a recent cross-industry survey of 250 global C-suite and board-level executives, cost reduction has become essential, with more than 85% of respondents citing it as a key issue in their business. Cost reduction has become an essential agenda item with senior executives Pressure to improve company performance may originate from changing market conditions, enterprise strategy, business model, or external factors Cost reduction initiatives Primary drivers of cost reduction Headcount reduction is clearly not the primary focus of cost reduction programs Respondents expressed common ground in factors driving cost reduction within their own organizations Business process improvement 77% Competitive pressure 55% Supplier cost reduction 60% Profitability 50% IT optimization 49% Increasing investor demand 31% Headcount reduction 47% Globalization 31% Outsourcing 46% Increasing board/audit demand 29% Training programs 37% Finance infrastructure improvement 20% retention programs 33% Finance SSC/outsourcing 19% 0% 20% 40% 60% 80% 0% 20% 40% 60% Source: The Economist Intelligence Unit, on behalf of Ernst & Young, surveyed 250 C-Suite and board level executives in September and October 2007
But, fewer than 1 in 3 recent cost reduction programs have sustained improvements in performance Sustainability of cost reduction benefits within 115 multinationals (FTSE 350) analysis of year-on-year performance, 2001-2006 Savings leakage examples • Resources assigned to initiative lack necessary skill sets or are diverted into other assignments • Costs and timing to implement are underestimated • Execution delays reduce run-rate impact • Savings double-counted with another area • Inappropriate cutting of capabilities leads to costs of “growing back” 100% 70% of companies failed to improve their cost/ revenue ratio year - on-year for 3 years after announcing a significant cost reduction program 63% 41% 30% % of companies sustaining benefits through year 1 % of companies sustaining benefits through year 2 % of companies sustaining benefits through year 3 Total cost reduction programs Source: Ernst & Young analysis Why are cost reduction efforts failing to deliver or sustain the intended benefits?
Cost reduction Strategy How can costs be reduced without compromising our competitive advantage? How do we sustain our cost reduction efforts? How do we establish ongoing monitoring of benefits realization that is in line with our BPM system? Have the opportunities been analyzed not only for costs and benefits, but also interdependencies, complexity, timing, redundancy and risk? Do we have sufficient program management and supporting tools? How can an effort of this magnitude be managed across the entire enterprise and still maintain momentum? As they become more deeply involved in cost reduction efforts, companies face these challenges which trigger fundamental questions
Most cost reduction efforts lose their steam before true transformation is achieved Low Hanging Fruit Transformation Strategic portfolio approach to cost reduction Waste elimination and Lean Cost management and control processes Difficulty to Implement Contracts and 3rd party spend management Clarity of operating cost drivers & financial plans Discretionary spend Sustainability
Common approaches to ECR and common points of failure Reasons for failure: Common approach Traditional “How” Top Down “Top-down” review of the business – typically organization and process changes are required. • Cost team frames “available” population of costs and strategic options • Cost team and department leads responsible for analysis to identify potential opportunities (e.g., organization alignment and reallocation of work) • Tend to bet on a single solution (e.g., org redesign, IT system change, shared services, off-shoring, etc.) • Complexities of reducing costs and existing behaviors are not changed Slash and Burn Business as usual but at less cost – reduces operating plans by a set target (e.g., 10% cost reduction). • Overall target set by CEO or CFO • Does not differentiate between lean or high-value processes and wasteful / low-value • Tends to capture the “easy to cut” costs instead of the “should be cut” • Reactive and focused on survival • Rarely results in lasting savings • Due to arbitrary nature can destroy value • Negative impact on morale and culture Boil the Ocean A bottom-up detailed analysis across all departments to identify potential opportunities. • Cost team frames “available” population of costs • Cost team or department performs extensive interviewing, process analysis and benchmarking to enhance process efficiency and leverage technology • Completely integrated and coordinated execution • Slow and complex • Difficulty assigning accountability • Typically loses momentum and focus • Departments become personally invested in their own budgets and rarely find waste
Value Embed sustainability by reducing the right costs and redeploying expenditures to areas that drive competitive advantage Improve pace through rigorous stakeholder engagement and project management Identify the maximum potential and delivermore value Time Technical limit of maximum potential Actual value delivered The design of successful cost management programs share a focus on three primary factors • Clear strategy and objectives • Create clear vision and definition of success • Savings estimates are established and budgeted Value Realized by carefully examining every element of addressable spend • Focus on the right costs • Cost baseline established or well understood • All spend areas examined, addressable costs defined • Apply a variety of cost reduction levers Pace Established via effective project management, focus, and balancing short and longer term savings • Sponsorship, momentum and project management • Strong and consistent executive support • Quick wins to establish momentum • Accountability to milestones regardless of challenges of day jobs • Ensure balance between time, cost and quality Sustainability Shift spend to activities central to performance • Maintaining savings over time • Initiatives align to strategy / capabilities • Execution accountability, ownership and transparency • Broad stakeholder group involvement and collaboration • Maintain continuity in project staff • Formal benefits capture processes All cost programs should be designed with pace, value and sustainability in mind from the beginning
Enterprise Cost Reduction as part of a portfolio of continuous performance improvement agenda Financial Performance Agenda Grow New Revenue Streams Reduce Value Leakage Optimise Cost of Goods Sold Reduce SG&A Costs Procure more effectively Minimise Tax Burden Release unproductive assets • Direct costs (eg, Strategic Sourcing) • Indirect Costs (eg, Travel & Expenses) • Strategic Pricing • New Market Entry • Market Growth • New Products • M&A • Customer Service • Sales • Marketing function • Finance • HR • IT • Facilities • Legal • Corporate Centre • Price Optimisation • Customer Strategy • Channel Strategy • Product Portfolio • Marketing Spend • Trade Terms • Capital Allowances • R&D Allowances • VAT • Compensation Design • Tax Efficient Supply Chain • Product Development • Manufacturing • Distribution • Working Capital • Order to Cash • Procure to Pay • Inventory Management Enterprise Cost Reduction Market Entry & Growth Revenue growth
Enterprise cost reduction requires enterprise-wide focus Enterprise Cost Reduction Functional cost reduction Product cost reduction Working capital efficiency • Back Office Functions and Processes (Finance, Accounting, Procurement, HR) • Project-Based Activities • Procurement Spend • Technology • Facilities / Infrastructure • Front Office and Operations Functions and Processes (Sales, Marketing, R&D, Product Development, Manufacturing / Service Delivery, Distribution) • Product / Region / Channel / Customer Segments • Direct Materials • Specialty Functions (Treasury, Supply Chain, Tax) • Current Liquid Assets • Inventory (RM, WIP, FG) • Current Liabilities • Tax Efficiency Realization of sustainable reductions in corporate infrastructure / G&A overhead expenses Harness operations experience to continue to provide effective support services throughout the organization Infrastructure platforms must be able to readily absorb an acquisition in order to realize cost synergies Remediation of cost elements driving low profit or unprofitable products / segments (regions, channels, customer segments) Cost base must be structured to enable lean growth, either organic or acquisitive growth, as a key driver in value creation Improve asset performance by reducing the amount of capital tied up in net current assets One-off cash releases from the balance sheet can be re-invested in higher return activities to create incremental value
Track progress and benefits Report status and results Re-balance project portfolio Identify ineffective projects or new needs Getting your own cost reduction program started Identify end to end stakeholders of problem processes “SWARM” workshop the process As an enterprise develop a portfolio of projects Identify opportunities using benchmarking Prioritize issues based upon cost/benefit of the fix • Benchmark your processes • Lots of free sources: APQC, industry organizations • Critical to understand the limits of benchmarking • Involve all stakeholders • Most processes cross org chart lines • An effective SWARM event to capture the AS-IS process, the real issues, and identify potential fixes in as little as a single day • Create a portfolio of projects • Take the results of multiple SWARMS and balance cost, capacity, and speed to benefits • Assign accountable executives for each initiative • Formal benefit capture function • Track and report on the progress of projects within enterprise portfolio of projects (traditional PMO role) • Monitors potential benefits during AND AFTER project completion to ensure benefits do not leak back in • Drives continuous rebalancing of portfolio Benefits Capture
Enterprise Cost Reduction – Client Example Following a strategic transaction, this global manufacturer of mobile devices focused on significantly reducing operating expenses (>$200M in recurring annual costs) to improve its competitive positioning. The client engaged EY to review its cost structure across functional areas and develop a roadmap to achieve the desired cost reduction, including both “quick wins” and structural cost issues. EY utilized a team with expertise in Strategy and Enterprise Cost Reduction, and cross-functional advisors in Finance, IT, Legal, Procurement, Real Estate, and Tax EY worked with senior management to develop a cost reduction roadmap with targeted reductions across the business, including a specific focus on achieving short-term cost reduction goals, reducing operational complexity, and increasing utilization of low-cost facilities. More than $250M in annual savings opportunities were identified across a number of functional areas, including: Rationalizing the facility footprint Reducing indirect procurement spending Prioritizing research and development activities Moving back-office G&A processes to low-cost geographies and shared service centers “Quick-hit” actions were also taken across a number of functional spend areas to make an immediate, in-year impact to the cost structure Global mobile device manufacturer Dramatically reduce operating expenses to improve profitability
E&Y measured every single employee on an analytical risk ranking model and performed substantive review of key outliers and confirmed multiple cases of policy abuse T8 Lagged Submission Score T6 Meals Over Limit T9 Total Non-AMEX Expenses T10 Non-AMEX Expense Percentage T5 Personal Expenses % T11 Potentially Duplicative Expenses T3 Personal Expenses T13 Total Expenses T20 Round Non-AMEX Expenses T22 Un-imported Charges T1 Round Expenses T24 Miscellaneous Mismatch
Case Study: Travel Policy Revision and Demand Reduction E&Y teamed with policy owners and business unit leadership to reduce travel cost by 20% -30% with the use of clustering identification and geographical tracking tools Opportunity Identification and Analytical Processing Ernst & Young leveraged data from American Express and SAP Employee Expense Management to create total cost metrics and business unit travel patterns and spending profiles. 1 Realization Tracking – Annual Savings of $65M Realization is led and tracked by Ernst & Young reporting 3 2 BU Tactical Planning E&Y and BU Sponsor review report card to isolate and drive opportunities and develop communications and tracking plan Goal
Case Study: Accounts Payable Cash Flow OptimizationA rapid four week diagnostic review of the Accounts Payable process identified $120M+ in cash flow benefits and $8M in over payment recovery EY analyzed paid invoice detail for 7 months and made the following key observations: Realization Analysis and Insight • Realization team recovered ~$8.4M in overpayments. Provided client with 8 controls to prevent future occurrences. • Duplicate payments of ~$16.8M. 12K (16%) of 75K vendors in the master file are either duplicate or similar. Quick Hit • The payment term clock for 30.4% of invoice payments starts on paper invoice date; with all contracts noting start on entry date • Shifted the payment term clock to start on date of entry instead of invoice date, generate a cash flow benefit of ~$31.6M Quick Hit • Payments in advance of invoice terms constitute 18.2% of total spend ($5.4B) • Shifted payment processing frequency to daily and reduced 50% of early payments, generating a cash flow benefit of ~$14.7M Quick Hit Value obtained by our client Recovered Duplicate Payments ~$8.4M Cash Flow Benefit ~$121.6M Improved control environment and ongoing monitoring / benchmarking
Accounts Payable Global Scorecard Comparison against Leading Industry/Company Metric Sample 1 Source – APQC Inc.; *Company/EY leading indicator where external metric not available
Enterprise Cost Reduction Transforming the Cost Structure for Sustained Benefits