Download
1 / 47
470 likes | 789 Views
U.S. Supermarket Trends. www.hoytnet.com. 8912 East Pinnacle Peak Road • Scottsdale, AZ 85255 Phone (480) 513-0547 • Fax (480) 513-0548 • E-Mail: chrishoyt@hoytnet.com • nancyswift@hoytnet.com. Today. Consumer Trends Trade Trends Winning Business Models & Success Principles.

E N D
U.S. Supermarket Trends www.hoytnet.com 8912 East Pinnacle Peak Road • Scottsdale, AZ 85255 Phone (480) 513-0547 • Fax (480) 513-0548 • E-Mail: chrishoyt@hoytnet.com • nancyswift@hoytnet.com
Today • Consumer Trends • Trade Trends • Winning Business Models & Success Principles
Consumer Trends – Population & Lifestyle Changes That Affect CPG Food Purchasing Decisions
Key Trends • Value Shopping – Has become a national obsession • Time Pressures – Have changed what we eat, how we eat and where we eat it • Population Fragmentation – Is dictating the need to learn how to market to different ethnic and age groups
Value Shopping – Root Causes • 2001 Distribution of Total U.S. Income By Population Fifths Quintile Mean Income % Distribution of Income I II III IV V 20% 20% 20% 20% 20% 50.2% 23.0% 14.6% 8.7% 3.5% $146.0 $66.8 $42.6 $25.5 $10.1 73.2% 40% Middle Class 12.2% 40% Total U.S. Mean $58.2 Source: U.S. Census Bureau, 2003; Dept of Commerce
Value Shopping – No Change In Sight • Mean Income Trends By Population Fifths, 1970-2001(2001 Dollars – Per Household) (+81%) Top 20% To p 20% (+50%) TOTAL US MEAN (+62%) 2nd 20% (+34%) 3rd 20% (+28%) 4th 20% 5th 20% (+38%) Source: US Census, Bureau of Labor Statistics, 2003. All data adjusted for inflation.
Time Pressures – Root Causes • 75% of families now have two wage-earner incomes. • 65% of married women with children under six are in the workforce. • 70% of working women say that the number of things they have to do in a day is a big cause of stress. • 58% of consumers say convenience is a key determinant of what they eat and where they eat it. • 40% of the population say they have no idea of what they are having for dinner at 4:00 pm.
Time Pressures – Impact On Family Meal Preparation and Eating Habits: • The average time spent in meal preparation these days is less than 20 minutes per day – down from 2.5 hours in 1960. • Time Spent Preparing Meals • 2.5 Hours • 1 Hour • 20 Minutes Source: National Eating Trends Data
For Most, Food is Now a “Low Involvement” Purchase • Food as a % of Personal Consumption $,1960-2000
Net On Time Pressures • “Quick, easy and convenient” now drives the strategy • Must not only include “with it” product assortments but store operations – how fast the customer can get out the door • Retailers must think of themselves as facilitators, not just conduits for products
Population Fragmentation Will Dictate The Need To Market Discreetly To Very Different Population Segments • Chief among these are: • Young Singles • Hispanics • Seniors
Young Singles Have Emerged As A Force In Their Own Right : • Between 1970 and 2000: • The average size of U.S. households shrank from 3.14 to 2.62 persons • Households with 5 or more persons disintegrated from 21% to 10% (52% drop) • At the same time, one person households (singles/divorced/widowed) catapulted from 17% to 31% (82% increase) • 2000 vs. 1970 Changing Household Size in the U.S. 105 81% 69% 63 40% 24% Total HH (Millions) Family HH (% of total HH) Married HH w/child (% of total HH) Source: US Census, Bureau of Labor Statistics, 2003. All data adjusted for inflation.
The Hispanic Population Is Currently The Fastest Growing Segment of the American Public and Is Expected To Double By 2050 • Projected Population Growth by Segment, 2000 - 2050 • 2000 • 2050 • Pop. Segment • MM • % • MM • % • Index vs. 2000 • White non-Hispanic • Hispanic • Black • Asian/So. Pacific • Other • Totals • 194 • 32 • 35 • 11 • 3 • 257 • 70.5 • 11.6 • 12.7 • 4.0 • 1.2 • 100.0 • 213 • 98 • 59 • 38 • 12 • 420 • 50.7 • 23.3 • 14.0 • 9.0 • 2.8 • 100.0 • 110 • 306 • 168 • 345 • 400 • 152
Seniors Will Comprise the Largest Single Segment Of The U.S. Population By 2020 • Growth of 55+ Population Between 2000 and 2020(As a % of total pop.) • 30% of total pop. • 97.5MM • 22% of total pop. • 60.5MM • +61% vs. 2000 • +18% vs. 2000 Source: U.S. Census Bureau
Net on Population Fragmentation: • Retailers must change their “all things to all people” and “build it and they will come” approaches and instead become experts at targeting specific consumer segments • Mining one’s own data and developing close relationships with one’s heavy users is already the peremptory starting point • Being willing to target and settle for a smaller piece of the pie is currently proving to be a winning formula
Translation to Real World Positioning: Pick Your Ground and Plant Your Flag: Income$146.0 • Aging Affluent • Favor retailers who cater to taste/ lifestyles • Variety more important than price • Prefer smaller stores/personal service • Not a “deal” shopper • Courtesy and “experience” are key • Time Calibrators • One-stop shopping • Fast service is everything • Full variety is key • Premium quality • Blind to deals $66.8 Hours0 Hours120 40 $42.6 80 • Price Calibrators • Completely disloyal • Commodity vs. quality • Cherry-picking an art • Service, decor unimportant • A continually moving target • Up & Comers • Value-channel stock-up shopper • Use supermarkets for weekly variety fill-in • Fast service • Key P.L. shopper • Growing families, growing income — soon to be affluent $25.5 $10.1Income
These Trends Are Easy To Spot Just By Looking At The Current Fastest Growers Top 10 Fastest Growing CPG Categories In 2001 2001Dollar Growth 2001 Dollar Sales ($MM) 2001 % Dollar Growth $377.2 $333.1 $246.2 $226.0 $184.5 $160.0 $129.2 $90.1 $82.4 $80.9 Bottled Water Deli-Self Serve Butter Yogurt Frozen Novelties Refrigerated Entrees Unbreaded Frozen Shrimp Refrigerated shakes/drinks Health bars and sticks Diet Carb Beverages-Rem $2,282.2 $3,446.1 $1,276.5 $2,289.3 $1,941.2 $865.0 $489.2 $188.2 $285.9 $881.6 19.8% 10.7% 23.9% 11.0% 10.5% 22.7% 36.9% 91.9% 40.5% 10.1% Source: AC Nielsen Strategic Planner: Food, Drug & Mass excluding Wal-Mart. 52 Weeks ending 12/29/2001
Trade TrendsThe Sea Change in U.S. Retailing and the Key Trade Factors that are Driving It
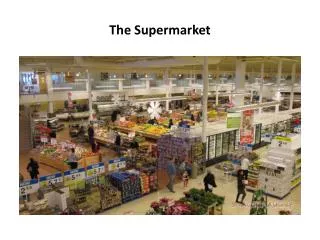
Today 120K Convenience Stores 32K Supermarkets 6K Mass Merchandisers 20K Drug Stores 1K Club Stores 6K Dollar Stores McDonaldsBurger KingWendy’sJack-in-The-Box 45% of Food DollarsSpent Away From Home 1950’s No Fast Food No Mass Merchandisers No Clubs No Supercenters Independents Dominated Drug A&P Dominated Food Most CPG-type Products Sold Through Supermarkets Most Meals Prepared and Eaten at Home Outlet Saturation
SKU Proliferation • SKU Growth: 1945 - 2000 New Food Items: 1980 = 2,689 2000 = 16,390 Source: Insight Out of Chaos, 2001
% Buyers In Mass Availability Of Same Items In Different Channels • SuperCenters • Grocery • Mass • Clubs • Drug • C-Stores • Non-Choc. Candy • Chocolate Candy • Artificial Sweeteners • Ground Coffee • Dried Fruit Snacks • HH Cleaners • Toilet Tissue • Paper Towels • Liquid Soap • Soft Drinks • 79.4% • 83.6% • 80.2% • 90.2% • 83.2% • 78.6% • 86.4% • 77.8% • 55.4% • 97.5% • 62.0% • 58.0% • 21.8% • 30.0% • 22.8% • 42.9% • 50.3% • 25.1% • 45.0% • 44.7% • 18.0% • 16.6% • 8.1% • 11.3% • 7.2% • 12.1% • 16.5% • 6.6% • 11.6% • 16.9% • 12.6% • 10.4% • 11.9% • 15.5% • 12.7% • 11.4% • 10.4% • 10.0% • 10.3% • 9.2% • 43.5% • 5.1% • 5.2% • 7.7% • 4.2% • 14.7% • 19.8% • 9.5% • 9.9% • 24.1% • 9.5% • 1.5% • 0.4% • 1.0% • 0.8% • 0.8% • 1.6% • 0.6% • 0.2% • 20.4% Source: Scarborough Research, 1999-2000
Channel Pricing Index on Selected Consumables(Scottsdale, AZ, 8/7/2002) Price-Based Competition • Food • Supercenters • Clubs • Formula 409 • Pine Sol • Pledge • Lysol Disinfecting Spray • Windex • Arrowhead Water • Tea Bags • Maxwell House Coffee • Sweet ‘n Low • Equal • Hershey’s Kisses • M&M’s • Bath Tissue – 36-48 Roll • Bath Tissue – 12-24 Roll • Napkins • Towels (roll) • 100 • 100 • 100 • 100 • 100 • 100 • 100 • 100 • 100 • 100 • 100 • 100 • 100 • 100 • 100 • 100 • 61 • 92 • 68 • 66 • 59 • 92 • 49 • 71 • 92 • 72 • 66 • 65 • 54 • 73 • 60 • 77 • 53 • 58 • 57 • 54 • 37 • 65 • 45 • N/A • 43 • 48 • 67 • 54 • 41 • 57 • 39 • 73 • Source: Hoyt & Company Store Checks w/o 8/7/2002. • Largest sizes carried indexed to Food on a per unit (oz/sheet/count) basis.
Other Trade Trend Tidbits: • The most successful new product introductions are those that save time or improve appearance or health • RFID – radio frequency identification tags – on the launching pad and inevitable • Irradiated Meats – starting slowly but also inevitable • Consolidation has slowed as supermarkets struggle to defend against the Wal-Mart juggernaut and try to absorb what they have already bought • Everyone installing on-premise eat-in facilities • HEB with “Good to Go” • Walgreen’s “Welcome Home Café”
Value Retailers Supercenters, Clubs and Dollar Stores
Wal-Mart’s Expansion into Food • The most significant factor in food retailing since the advent of self service in 1916: • Invents nothing but perfects everything • Does nothing different but tries to do everything better • Disdains emotion but rewards pragmatism, commitment and discipline • Between 1980 and 2001 Wal-Mart grew 35x’s faster than the market:
Wal-Mart’s Expansion into Food • Wal-Mart is now the nation’s #1 food provider with 2002 food sales of approximately $80B (vs. $50B for #2) • Objective is 30% share of every business it enters • This week, USA Today reported one analyst’s forecast that supermarkets’ share of the grocery business will drop to 34% by 2010 from its current 53% with the bulk lost to Wal-Mart
The Heart of the Wal-Mart Competitive Advantage – Low Operating Costs • Wal-Mart vs. Leading Supermarket Financials: 2002 Source: Company SEC filings, Kroger & Albertson’s through 3 quarters, Wal-Mart & Safeway reflect full FY2002
What Wal-Mart Has Done to Achieve its Growth . . . Beyond Price • Multi-format: Discount, Supercenters, Club, Neighborhood Stores and on-line to address consumer purchase occasions • Maintains and USES a massive database to understand its consumers and their shopping behavior • Assorts stores based on demographics • Allows regional variances in products offered • Retail-tainment – “Fun place to Shop” • Bonds with suppliers to improve efficiency/lower prices • Works to become part of the local community • Offers parking lots for local fundraisers (HS car washes, etc) • Charitable donations to local causes
Other Winning Formats – Club Stores • 2001 combined food sales of approximately $38.5B $B# Stores SAM’s $18.4 498 Costco $17.7 363 BJ’s $2.4 130 • Business Model: Membership fees contribute as much as 80% of operating profits enabling cost + 10% retails • Demographic Target: Small businesses and affluent consumers • Positioning: High quality national brands and private labels at 10-30% discounts to average market prices • Average Transaction Size: $80 - $85 • Penetration grew from 49 to 55% between 1996 and 2001; trip frequency grew from 8 to 10
Club Service Offerings: Customer Retention and Margin Enhancement Club Membership Services: 2000 • Costco Wholesale • Consumer Group $45 • Business $35 • Exec. Consumer, Business $100 • Executive Membership • 2% Cash Back • Business Credit Card Processing • Business Equipment Leasing • Business Health Care • Business Line of Credit • Business Payroll Processing • All Members • Auto Buying • Business, Personal Checks & Forms • Long Distance • Mortgage • Real Estate • Smart Office • BJ’s Wholesale • Consumer Group $40 • Business $35 • Premier Benefits • Auto Buying • Business Credit Card Processing • Business Payroll • Business, Personal Checks & Forms • Car Rentals • Embroidered Apparel Service • Export • Extended Warranty • Healthcare Network • Long Distance • Pre-paid Phone Cards • Real Estate • Vacations • SAM’s Club • Consumer Group $35 • Business $35 • Elite Consumer, Business $100 • Elite Membership • Roadside Assistance • Home Services • Internet Banking • Insurance • Savings Guide • Prescription Drug Program • All Members • Auto Buying • Travel Program • Boat & Recreational Buying • Long Distance • Business Checks, Forms • Mail Order pharmacy • Internet • Time Management Source: WCF, 2000
Other Winning Formats – Dollar Stores • $15B channel dominated by Dollar General, Family Dollar and Dollar Tree Top 100 Rank Sales % Prev Year # Stores % Per Year Dollar General 39 $5.3B +17.0 5,540 +10.8 Family Dollar 53 $3.7B +17.0 4,141 +12.3 Dollar Tree 90 $2.0B +17.0 1,975 +14.2 • Business Model: Quality closeouts, liquidation merchandise priced at 30-40% below market averages • Demographic Target: $30 - $50K, retirees and those on fixed incomes • Positioning: “A new market beneath the standard discount market” • Average transaction size: $9.00 (with most items priced around an even $1.00)
Dollar Stores (cont’d) • Big sellers: • Greeting cards for $1.00 (vs. $2.00 - $2.95 elsewhere) • Soaps and detergents • Gift bags • Wraps • Hair care • Videos • Wine (in states where legal) • Now beginning to focus on food: Dollar General just added coolers in 1,400 stores to stock refrigerated and frozen. • While targeted at the economically disadvantaged, Dollar Stores are now starting to attract the affluent as everyone is looking for a bargain these days.
Trip Loss to Other Channels • Shopper Trips By Channel (1996 – 2001)(Avg. # Trips/Channel/Year) • Traditional Formats • Value and/or Convenience Formats Total Trips • Down 2 Billion Trips in Five Years 180 167 Source: AC Nielsen Homescan
Daily Conversions to Supercenters • Share/Share Chg of Supercenter Shopper $ by Channel -0.6 -1.2 +0.1 +0.0 -0.2 +0.3 -0.5 +2.1 Source: ACNielsen Cross Outlet*Facts 2000; Total US
Huge Share Losses in Traditional Categories Sales Lost Over 9 Year Period Total of 9 Categories: Detergents, Hair Care, Paper Towels,Dentifrice, Diapers, Coffee, Bath Tissue, Fabric Softener, Peanut Butter Channel Share Trends, 1999 vs. 1989* 1989/1990 1998/1999 Grocery Mass Merchants Warehouse/Clubs All Other Outlets 75.6% 13.1% 3.5% 7.8% 54.5% 26.9% 9.7% 9.0% * 52 weeks ending in fiscal year Source: Procter & Gamble and “Growing The Center Store” AC Nielsen
Value Retailers’ Success Ingredients – Common Characteristics • Business models that automatically differentiate • No deviation from original business model • Focus on a specific consumer group • Fluid merchandising that maximizes quick rotation & change – quick in-and-out, frequent “surprises” • Below-market acquisition costs, low operating expenses & below-market pricing consistency • Leverage supplier dollars to keep prices low vs. enhance profitability • Willingness to settle for part of the pie – none attempt to be all things to all people all of the time
Four Supermarkets Who Buck the Trends • H. E. Butt (San Antonio, TX) – 295 stores, $8.7B • Publix (Lakeland, FL) – 697 stores, $4.8B • Wegman’s (Rochester, NY) – 79 stores, $3.1B • Stew Leonard’s (Norwalk, CT) – 3 stores $200MM
What These Four Companies Have in Common • Long-term thinking: All follow a strategy and resist reacting to daily threats • Customer Focus: Base assortment & merchandising decisions on what their customers want, not on what their competitors are doing or on the latest hot deal • Strong Community Ties: All participate in & contribute to local community events which they aggressively leverage in in-store merchandising and advertising activities • Market-Leading Innovation: On-premise restaurants, take-out food, non-food merchandise “surprises”, self-scanning & self-checkouts and “traffic directors” • Well-trained & Courteous Employees: The customer is always king • Store as a Brand: Customers know what to expect and can “trust” the experience on every visit
Moral of story: • It’s not just price; it’s a combination of factors, carefully blended and balanced to satisfy a particular consumer need or aspiration. Each retailer has to search within its own strengths to find the right formula. There are no easy answers.
We Appreciate The Time and Attention You Have Given Us Today • Specifically, we want to thank Alan Nissalke and the American Logistics Association for inviting us and trust that this has been both fun and helpful. www.hoytnet.com 8912 East Pinnacle Peak Road • Scottsdale, AZ 85255 Phone (480) 513-0547 • Fax (480) 513-0548 • E-Mail: chrishoyt@hoytnet.com • nancyswift@hoytnet.com
Top 15 “Quick, Easy, Convenient” Categories Based on Category Dollar Growth • Sales • ($ MM) • Supermarket Share • % Growth vs. YA • $ Growth($MM) • SNACKS CATEGORY • DELI-SELF SERVE • Potato Chips • Sliced lunchmeat ref pkgd • Precut salad mix/greens • Refrigerated Entrees • Shredded cheese • Fzn unbreaded shrimp • BAKED GOODS FZN • Frozen entrees-Italian 1 food • Health bars & sticks • Frozen poultry • Ready-To-Serve Entrees • Snack crackers • Creamers-liquid • $8564.99 • 3446.09 • 2548.96 • 2479.26 • 1853.69 • 864.99 • 1724.31 • 479.24 • 1434.07 • 1215.91 • 285.88 • 883.42 • 135.81 • 496.64 • 517.58 • 62.5% • 80.4% • 69.5% • 77.4% • 85.2% • 81.3% • 82.7% • 77.0% • 78.6% • 78.2% • 44.5% • 62.0% • 74.8% • 61.2% • 84.5% • 7.2% • 10.7% • 7.3% • 7.4% • 9.6% • 22.7% • 8.3% • 36.9% • 8.9% • 9.5% • 40.5% • 8.5% • 90.7% • 13.7% • 13.0% • $575.3 • 333.1 • 173.4 • 170.8 • 162.4 • 160.0 • 132.1 • 129.2 • 117.2 • 105.5 • 82.4 • 69.2 • 64.6 • 59.8 • 59.5 Source: Progressive Grocer Annual Consumer Expenditures Study, 9/02
Top 15 Ethnic CategoriesBased on Category Dollar Growth • Sales • ($ MM) • Supermarket Share • % Growth vs. YA • $ Growth($MM) • Dry-mix Mexican tortillas • Frozen entrees-Mexican-1 food • Frozen entrees-Oriental-1 food • RTS -Oriental 2 foods • Canned Veg-tomatoes • Fruit drinks canned • Juice/drinks • Tequila • Sauces-Misc SS • Olives-black • Peppers • Dry-mix Mexican shells • Cooking sauce • RTS - Mexican specialties • Frozen entrees-Oriental-2 food • $803.92 • 461.23 • 437.94 • 234.64 • 332.95 • 120.28 • 343.17 • 370.83 • 93.34 • 222.36 • 175.33 • 169.21 • 137.22 • 76.93 • 20.76 • 83.8% • 68.8% • 76.2% • 83.3% • 79.4% • 71.7% • 68.1% • 29.6% • 71.2% • 81.4% • 76.3% • 84.8% • 78.2% • 80.3% • 84.1% • 10.4% • 19.4% • 10.3% • 15.2% • 9.8% • 32% • 9.0% • 8.2% • 25.1% • 7.5% • 9.4% • 7.3% • 9% • 12.5% • 66% • $75.7 • 74.9 • 40.9 • 31.0 • 29.7 • 29.2 • 28.3 • 28.1 • 18.7 • 15.5 • 15.1 • 11.5 • 11.3 • 8.5 • 8.3
Top 15 Health CategoriesBased on Category Dollar Growth • Sales • ($ MM) • Supermarket Share • % Growth vs. YA • $ Growth($MM) • BOTTLED WATER CATEGORY • YOGURT CATEGORY • Yogurt • Diet Carbonated Bev • Hot Cereal • Yogurt shakes/drinks • Sugar substitutes • Water purifiers/filters • Refrigerated veg juice • Insect repellents • Dietetic Choc Candy • Wasp & hornet killers • Nectars • Refrigerated pineapple juice • Flying insect spray • Roach traps & motels • $2282.17 • 2280.34 • 2185.06 • 881.56 • 834.38 • 95.28 • 237.19 • 55.62 • 10.62 • 36.79 • 15.25 • 17.71 • 24.74 • 10.28 • 12.99 • 2.27 • 59.4% • 83.2% • 83.4% • 79.6% • 79.2% • 77.3% • 57.5% • 14.0% • 59.2% • 24.3% • 27.7% • 30.9% • 93.0% • 96.1% • 38.6% • na • 19.8% • 11.0% • 9.7% • 10.1% • 7.1% • 51.2% • 11.3% • 10.3% • 80.3% • 11.4% • 24.5% • 20.3% • 8.5% • 22.0% • 12.3% • 123.8% • $377.2 • 226.0 • 193.2 • 80.9 • 55.3 • 32.3 • 24.1 • 5.2 • 4.7 • 3.8 • 3.0 • 3.0 • 1.9 • 1.9 • 1.4 • 1.3
Top 15 “Personal Indulgence” CategoriesBased on Category Dollar Growth • Sales • ($ MM) • Supermarket Share • % Growth vs. YA • $ Growth($MM) • Butter • FROZEN NOVELTIES • Fresh cakes • Packaged sausage - dinner • Shakes & drinks/Refrigerated • Sour cream • Cream-refrigerated • Flavored milk - refrigerated • Specialty/imported cheese • Fresh rolls • Natural cheese • Fresh bakery • Natural swiss cheese • Charcoal • Frozen desserts • $1276.46 • 1941.18 • 1370.04 • 1152.09 • 188.23 • 622.70 • 426.95 • 452.13 • 408.78 • 643.73 • 388.68 • 133.31 • 164.36 • 373.15 • 238.12 • 81.4% • 81.7% • 61.7% • 80.1% • 84.0% • 85.3% • 83.7% • 80.0% • 77.8% • 77.3% • 81.0% • 73.8% • 75.2% • 56.6% • 84.0% • 23.9% • 10.5% • 7.6% • 9.0% • 91.9% • 10.9% • 14.5% • 12.9% • 14.3% • 7.2% • 10.5% • 33.4% • 23.9% • 8.4% • 11.8% • $246.2 • 184.5 • 96.8 • 95.1 • 90.1 • 61.2 • 54.1 • 51.7 • 51.1 • 43.2 • 36.9 • 33.4 • 31.7 • 28.9 • 25.1