Download
1 / 1
10 likes | 163 Views
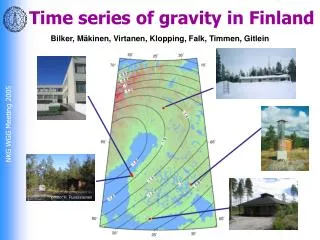
10. 15. 5. 8. Online Discovery of Group Level Events in Time Series. 10. 0. 6. 7. 0.35. 5. x 10. 4. 2.5. -5. 0. Vipin Kumar kumar@cs.umn.edu Computer Science & Engineering University of Minnesota. Gagan Bansal Gagan.Bansal@microsoft.com Cloud and Information Services Lab

E N D
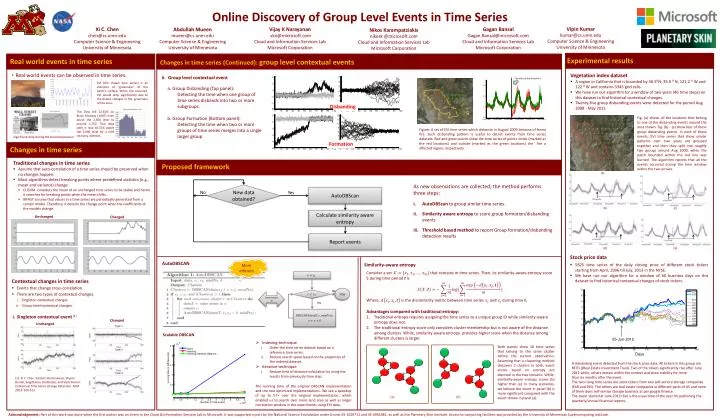
10 15 5 8 Online Discovery of Group Level Events in Time Series 10 0 6 7 0.35 5 x 10 4 2.5 -5 0 Vipin Kumar kumar@cs.umn.edu Computer Science & Engineering University of Minnesota Gagan Bansal Gagan.Bansal@microsoft.com Cloud and Information Services Lab Microsoft Corporation Xi C. Chen chen@cs.umn.edu Computer Science & Engineering University of Minnesota Vijay K Narayanan vkn@microsoft.com Cloud and Information Services Lab Microsoft Corporation Abdullah Mueen mueen@cs.unm.edu Computer Science & Engineering University of Minnesota Nikos Karampatziakis nikosk @microsoft.com Cloud and Information Services Lab Microsoft Corporation Naive 2 -5 -10 Indexing 0 -10 Indexing+Iterative distance -15 Disbanding EXR -2 2 -15 SSS 0.25 -4 -20 -20 0 10 20 30 40 50 60 70 80 90 100 70 80 90 100 0 10 20 30 40 50 60 Experimental results -6 Real world events in time series Changes in time series (Continued): group level contextual events EQY 05-Jun-2012 5 20 -8 TCO 15 1.5 0 KRC -10 10 0 20 40 60 80 100 120 140 160 180 running time in (Millisecond) • Real world events can be observed in time series. • Vegetation index dataset • Aregion in California that is bounded by 36.5⁰N, 35.9 ⁰ N, 121.2 ⁰ W and 122 ⁰ W and contains 3345 grid cells. • We have run our algorithm for a window of two years (46 time steps) on this dataset to find historical contextual changes. • Twenty-five group disbanding events were detected for the period Aug 2008 - May 2011. MAC Days 5 Group level contextual event -5 The date of the forest fire 0.15 HIW 0 EVI (the shown time series) is an indicator of “greenness" of the earth's surface. When fire occurred, EVI would drop significantly due to the drastic changes in the greenness of the area. Forest Fire CPT -10 1 -5 • Group Disbanding (Top panel): • Detecting the time when one group of time series disbands into two or more subgroups. • Group Formation (Bottom panel): • Detecting the time when two or more groups of time series merges into a single larger group CLP -10 Formation -15 ESS -15 AVB -20 -20 70 80 90 100 0 10 20 30 40 50 60 70 80 90 100 0 10 20 30 40 50 60 BRE 0.5 0.05 The Dow fell 22.61% on Black Monday (1987) from about the 2,500 level to around 1,750. Two days later, it rose 10.15% above the 2,000 level for a mild recovery attempt. 25-May-2007 25-May-2008 25-May-2009 25-May-2010 25-May-2011 25-May-2012 • Fig. (a) shows all the locations that belong to one of the disbanding events around the area shown. Fig. (b) - (e) show four of these group disbanding events. In each of these events, EVI time series that show similar patterns over two years are grouped together and then they split into roughly two groups around Aug 2009, when the patch bounded within the red line was burned. The algorithm reports that all the events occurred during the time window within the two arrows. 0 Figure: A set of EVI time series which disbands in August 2009 because of forest fire. Such disbanding pattern is useful to detect events from time series datasets. Red and green points show the time series of points inside (marked as the red locations) and outside (marked as the green locations) the fire a affected region, respectively. Significant drop during the Great Depression 0 0.5 1 1.5 2 2.5 3 3.5 4 4.5 5 4 Number of time series Changes in time series x 10 • Traditional changes in time series • Assume that auto-correlation of a time series should be preserved when no changes happen. • Most algorithms detect breaking points where predefined statistics (e.g., mean and variance) change. • CUSUM considers the mean of an unchanged time series to be stable and hence it searches for breaking points when the mean shifts. • BIFAST assume that values in a time series are periodically generated from a certain model. Therefore, it detects the change point when the coefficients of the models change. Proposed framework (a) As new observations are collected, the method performs three steps: AutoDBScanto group similar time series. Similarity aware entropy to score group formation/disbanding events Threshold based method to report Group formation/disbanding detection results New data obtained? AutoDBScan No Yes (b) (c) Calculate similarity aware entropy Unchanged Changed Report events (e) (d) • Stock price data • 5825 time series of the daily closing price of different stock tickers starting from April, 1996 till July, 2013 in the NYSE. • We have run our algorithm for a window of 60 business days on this dataset to find historical contextual changes of stock tickers. More efficient AutoDBSCAN Similarity-aware entropy Consider a set that contains m time series. Then, its similarity-aware entropy score S during time period tis Where, is the dissimilarity metric between time series and during time t. Advantages compared with traditional entropy: Traditional entropy requires assigning the time series to a unique group ID while similarity-aware entropy does not. The traditional entropy score only considers cluster membership but is not aware of the distance among clusters. While, similarity-aware entropy provides higher score when the distance among different clusters is larger. • Contextual changes in time series • Events that change cross-correlation. • There are two types of contextual changes. • Singleton contextual changes • Group level contextual changes. No Stop Same results as Yes Singleton contextual event [1] Changed Unchanged Scalable DBSCAN • Indexing-technique • Order the time series dataset based on a reference time series. • Reduce search space based on the properties of the ordered dataset. • Iterative-technique • Reduce time of distance calculation by using the results from previously time step. Both panels show 10 time seriesthat belong to the same cluster before the current observation. Assuming that a clustering method discovers 2 clusters in both, event scores based on entropy are identical in the two scenario. While, similarity-aware entropy scores (b) higher than (a). In many scenarios, we believe the event in panel (b) is more significant compared with the event shown in panel (a). A disbanding event detected from the stock price data. All tickers in this group are REITs ((Real Estate Investment Trust). Two of the tickers significantly rise after June 2012 while, others remain within the context and show stability for more than six months after the event. The two rising time series are stock tickers from two self-service storage companies (EXR and SSS). The others are real estate companies in different parts of US and none of them does self-service storage business as per google finance. The event started at June 2012 that is the usual time of the year for publishing the quarterly/annual financial reports. [1]. Xi C. Chen, KarstenSteinhaeuser, Shyam Boriah, Snigdhansu Chatterjee, and Vipin Kumar: Contextual Time Series Change Detection. SDM 2013: 503-511 The running time of the original DBSCAN implementation and the two optimized implementations. We see a speedup of up to 57× over the original implementation, which enabled us to search over more land area as well as larger correlation window in the experiments using EVI data. (a) (b) Acknowledgement: Part of this work was done when the first author was an intern in the Cloud & Information Services Lab in Microsoft. It was supported in part by the National Science Foundation under Grants IIS-1029711 and IIS-0905581, as well as the Planetary Skin Institute. Access to computing facilities was provided by the University of Minnesota Supercomputing Institute.