Download

1 / 15
150 likes | 298 Views
Urban Patterns & Resources. Physical Definitions 1. Definition – Urban settlement that has been legally incorporated into a self-governing unit. 2. Urbanized Area-Central city and surrounding built up suburbs a. Density exceeds 1,000 persons per square mile.

E N D
Physical Definitions 1. Definition – Urban settlement that has been legally incorporated into a self-governing unit. 2. Urbanized Area-Central city and surrounding built up suburbs a. Density exceeds 1,000 persons per square mile. b. 70% of U.S. – 30% in central city; 40% in suburbs 3. Metropolitan Statistical Area (MSA) – a. Population of at least 50,000 b. County w/i which the city is located c. Adjacent counties with population with 50% working in central city’s county. 4. 2003 – 362 MSAs in U.S. 5. Some MSAs overlap creating a Megalopolis – Boston to D.C.
Models of Urban Structure 1. Concentric Zone Model – cities grow in rings around CBD a. 2nd ring – zone of transition – industry, poor housing b. 3rd ring – working class homes c. 4th ring – newer, bigger houses d. Commuters’ zone or dormitory towns 2. Sector Model a. Sectors, not rings b. Certain areas more desirable than others – a wedge c. Both claim their models are proved in Chicago 3. Multiple Nuclei Model a. Includes more than 1 center around which activities revolve.
Social Area Analysis 1. None of the models explain where people tend to live 2. People usually prefer to live with/around people like themselves 3. Home owners live in the outer rings – concentric model 4. Rich owner will not live near poor owner – sector model 5. Same racial/ethnic background will near each other – nuclei model 6. Three models together – where will high-income, Asian American home owner live
Inner-city Physical Problems 1. Filtering – old, large homes subdivided into apartments for lower income people. a. Many houses are eventually abandoned – rent less than repairs 2. Redlining – areas that banks refuse to loan money. a. Community Investment Act – banks must loan equally 3. Urban Renewal – blighted inner-city neighborhoods a. Cities buy property, relocate residents b. Clear site, build new roads and utilities c. Replaced with public housing 1. Must pay 30% of income in rent 2. Managed by the government d. 1/5 of al UK housing is public e. Problems were caused by high rises – now building 2- or three-story 1. “Scattered site” – throughout the city 4. Gentrification – middle class people move into inner city neighborhoods and renovate a. Bigger, better construction, cheaper, shorter commute
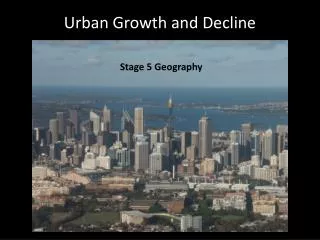
The Peripheral Model 1. Suburbs – 1950 = 20%; 2000 = 50%; 30% in cities a. 90 % prefer suburbs – yard, low crime, parking, etc. 2. Peripheral model – urban area consists of an inner city surrounded by a large suburban of business areas tied together by a beltway or a ring road 3. Density Gradient – number of houses per unit of land diminishes as distance from the city center increases. a. Number of people living in the center has decreased. b. Number of people in periphery has increased. 4. Sprawl – progressive spread of development over the landscape. a. High demand for open space b. developers reject land adjacent to other developments c. New Roads – wastes land and energy d. Europe – greenbelts – rings of open space
Local Government Fragmentation 1. Too many local governments make it difficult to solve regional problems a. 1,400 in New York; 1,100 in Chicago 1/ Long Island has 800 local governments 2. Council of Government – represents various governments in a region 3. Consolidation – combine city and county government 4. Smart Growth – limit suburban sprawl and preserve farmland a. “Fill in” already urbanized areas
Finiteness of Fossil Fuels 1. Renewable resources have an unlimited supply 2. Non-Renewable (most fossil fuels) forms too slowly including nuclear energy 3. Proven Reserve – amount of energy remaining in deposits that have been discovered a. Petroleum will last about 50 years b. Demand is increasing 1% per year c. Natural gas will run out in 60 years d. Coal will last 175 years
Consumption of Fossil Fuels 1. MDCs = 25% of pop. but consume 75% of world’s energy 2. Demand is increasing in LDCs – 50% in the next 20 years a. US/Europe imports more than half of their oil – increased competition b. Was cheaper to import it than extracting in the US – 43% imported today 3. 1970s – foreign owned oil companies were nationalized or controlled by locals a. OPEC – Organization of Petroleum Exporting Countries b. 1973-74 – refused to sell oil to MDCs c. Price of oil jumps from $3 to $35 d. Internal conflicts (war) and MDC stockpiles reduced price again e. Conservation – 14 MPG in 1975; 22 MPG in 2000
Nonrenewable Substitutes for Petroleum 1. Natural gas – cheaper to burn and less polluting a. Consumption has increased 4% per year b. Difficult to ship 2. Coal – pollution, mine safety, land subsidence, and economics hinder use of coal a. A lot of energy used to transport it 3. Nuclear – accidents, radioactive waste, limited uranium, distribution a. Cannot explode but meltdown – radioactive material in the atmosphere b. Pipes, concrete, water become “hot” with radiation 1. Stored at cooling tanks at facility buy almost full 2. Will last longer than any other civilization ever c. Only about 70 years of uranium left d. Costs several billion dollars to build
Global Warming – Global Scale 1. Suns rays pass through atmosphere heating the earth a. Some of the heat trapped, some returns to space b. Trace gases can trap that returning heat in the atmosphere raising Earth’s temp c. CO² in the atmosphere has 25% in 200 years 2. Rising temperatures could raise sea levels flooding NYC, Rio, etc. a. Patterns of precipitation would change agricultural regions - migration 3. Ozone Layer (protects us from UV) – CFCs deplete the protective layer 9 – 30 miles up
Water Pollution (Causes) 1. The typical American uses 180 gallons of water per day a. 1,400 per day if you include manufacturers, farmers, etc. 2. Steel, chemicals, paper, and food companies are the worst polluters 3. Municipal sewage – wastewater from sinks, tubs, toilets – treated then dumped 4. Agriculture – fertilizers and pesticides runoff into streams, etc. 5. Manufacturers, sewage – point source; farmers are nonpoint sources 6. Organic waste consumes oxygen starving fish – biochemical oxygen demand (BOD) a. Fertilizers nourish “pond scum” stealing more oxygen b. Chemicals are digested by the fish making them unsafe to eat
Land Pollution 1. We generate 4 lbs. of solid waste per person per day (glass, metal, plastic) a. Paper and cardboard make up the most 2. Solid wastes are concentrated in one area (others are dispersed 3. Decomposing material then leaks into the groundwater 4. Incineration and recycling have increased dramatically – creates more problems a. NYC exports 25,000 pounds of trash per day! 5. Hazardous waste – Love Canal in the 1930s a. Buried toxic wastes were uncovered in the 50s and slime showed in the 70s b. Residents developed liver ailments, nervous disorders, etc. 6. Companies are now transporting their waste to West Africa
Sustainable Development 1. Conservation – A balance between society and nature a. Consume at a less rapid rate than they can be replaced b. Fossil fuels are conserved for future generations 2. Preservation – Maintenance of resources in their present condition a. Nature is not a resource for human use 3. Sustainable Development – development that meets the needs of the present without compromising future generations 4. Environmental protection, economic growth, and social equity are linked a. Pollution controls are unpopular because it raises prices to consumers 5. The World Bank estimates 10% China’s GDP is lost to pollution 6. Some claim we have not exceeded Earth’s capacity – resources have no limit 7. More needs to be done to reduce gap between MDCs and LDCs 8. GDP of $5000 is the level a country (LDC) needs to attain to start to reduce polution from industrialization 9. WWF – Says we passed the sustainable level in 1980