Download
1 / 44
470 likes | 519 Views
Digital Image Fundamentals. Human visual system A simple image model Sampling and quantization Color models and Color imaging. Human Visual System. Brightness adaptation Brightness discrimination Weber ratio Mach band pattern Simultaneous contrast. Human Visual System.

E N D
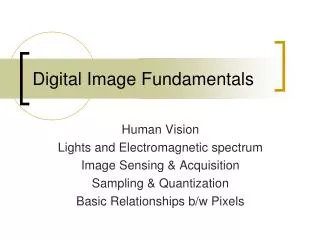
Digital Image Fundamentals • Human visual system • A simple image model • Sampling and quantization • Color models and Color imaging
Human Visual System • Brightness adaptation • Brightness discrimination • Weber ratio • Mach band pattern • Simultaneous contrast
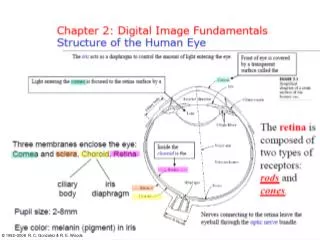
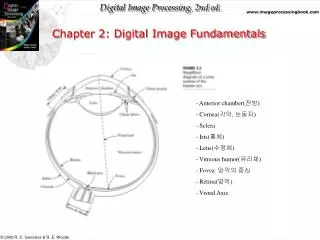
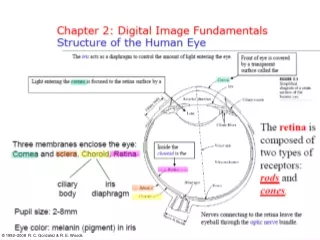
Human Visual System • Elements of visual perception The amount of light entering the eye is controlled by the pupil, which dilates and contracts accordingly. The cornea and lens, whose shape is adjusted by the ciliary body, focus the light on the retina, where receptors convert it into nerve signals that pass to the brain.
Human Visual System • Elements of visual perception • Cones • 6 – 7 million in each eye • Photopic or bright-light vision • Highly sensitive to color • Rods • 75 – 150 million • Not involved in color vision • Sensitive to low level of illumination (scotopic or dim-light vision) • An object appears brightly colored in daylight will be seen colorless in moonlight (why)
Human Visual System • Image formation in the eye • Distance between center of lens and retina (focal length) vary between 14-17 mm. • Image length h = 17(mm) x (15/100)
log (cd/m2) Human Visual System Human simultaneous luminance vision range (5 orders of magnitude)
Human Visual System • Brightness adaptation • HVS can adapt to light intensity range on the order of 1010 • Subjective brightness is a logarithmic function of the light intensity incident on the eye
Human Visual System • Brightness adaptation The lambert (symbol L) is a unit of luminance named for Johann Heinrich Lambert (1728 - 1777), a German mathematician, physicist and astronomer. A related unit of luminance, the foot-lambert, is used in the lighting, cinema and flight simulation industries. The SI unit is the candela per square metre (cd/m²). Source: Wikipedia
Human Visual System • Brightness adaptation • The HVS cannot operate on such range (10 orders of magnitude) simultaneously • It accomplishes this through (brightness) adaptation • The total intensity level the HVS can discriminate simultaneously is rather small in comparison (about 4 orders of magnitude)
Human Visual System For a given observation condition, the current sensitivity level is call the brightness adaptation level • Brightness adaptation Sensitivity of the HVS for the given adaptation level Anything below Bb will be perceived as indistinguishable blacks
Human Visual System • Brightness discrimination • Perceivable changes at a given adaptation level
Human Visual System • Brightness discrimination
Human Visual System • Perceived brightness is not a simple function of intensity – Mach band pattern
Human Visual System • Perceived brightness is not a simple function of intensity – Simultaneous contrast
A simple image model • Two-dimensional light-intensity function f(x,y) = l(x,y) r(x,y) l(x,y) - illumination component r(x,y) – reflectance component
A simple image model • l(x,y) - illumination range • r(x,y) – typical reflectance indixes • black velvet (0.01) • stainless steel (0.65) • white paint (0.80) • silver plate (0.90) • snow (0.93) log (cd/m2)
Sampling • Digitization of the spatial coordinates, sample (x, y) at discrete values of (0, 0), (0, 1), …. • f(x, y) is 2-D array
Quantization • Digitization of the light intensity function • Each f(i,j) is called a pixel • The magnitude of f(i,j) is represented digitally with a fixed number of bits - quantization
Sampling and Quantization • How many samples to take? • Number of pixels (samples) in the image • Nyquist rate • How many gray-levels to store? • At a pixel position (sample), number of levels of color/intensity to be represented
Sampling and Quantization • How many samples to take?
Sampling and Quantization • How many samples to take? • The Nyquist Rate • Samples must be taken at a rate that is twice the frequency of the highest frequency component to be reconstructed. • Under-sampling: sampling at a rate that is too coarse, i.e., is below the Nyquist rate. • Aliasing: artefacts that result from under-sampling.
Sampling and Quantization • How many gray-levels to store?
Sampling and Quantization • Non-uniform sampling • Non-uniform quantization
Basic relationships between pixels • Neighbors • Connectivity
Color Imaging • Light
Color Imaging • Visible light spectrum
Color Imaging • Trichromacy and human color vision
Color Imaging • Color image formation (acquisition) Observer (Camera)
Color Imaging • Power spectrum of standard illuminants
Color Imaging • Color image formation (acquisition) Color filters Of the sensor
Color Imaging • Color image formation (acquisition)
Color Imaging • The RGB Color Model • R, G, B at 3 axis ranging in [0 1] each • Gray scale along the diagonal • If each component is quantized into 256 levels [0:255], the total number of different colors that can be produced is (28)3 = 224 =16,777,216 colors.
Color Imaging • The RGB Color Model
Color Imaging • The YIQ Color Model • Video (NTSC) standard • Y encodes luminance; I and Q encode chrominance (“color”) • Black and white TV shows only the Y channel • Backward compatibility; efficiency
Color Imaging • Color Models, YCbCr
Color Imaging • More Color Models, see e.g.,
Color Imaging • More Color Models, see e.g.,
Color Imaging • Color image representation (in RGB space) = Red Green Blue
Color Imaging • Color image representation (in RGB space)