Download
1 / 32
350 likes | 836 Views
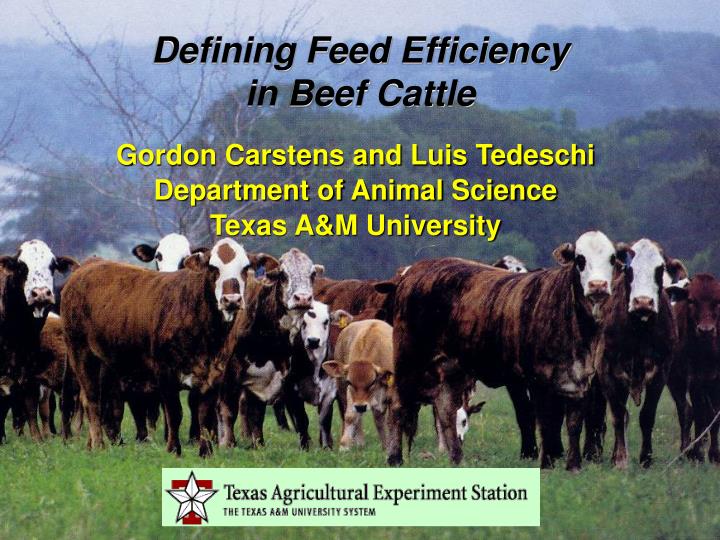
Defining Feed Efficiency in Beef Cattle. Gordon Carstens and Luis Tedeschi Department of Animal Science Texas A&M University. Projected global meat production (2001 to 2025) Thomas E. Elam ( Feedstuffs , 2004). Projected world demand for meat will increase 55% by 2025.

E N D
Defining Feed Efficiency in Beef Cattle Gordon Carstens and Luis Tedeschi Department of Animal Science Texas A&M University
Projected global meat production(2001 to 2025)Thomas E. Elam (Feedstuffs, 2004) Projected world demand for meat will increase 55% by 2025
“Crop yields (33%) and feed conversions (15-20%) will need to increase significantly over the next 20 years to meet global meat demands in an economical and environmentally sustainable manner” “We will need to continue to develop tools and technologies our producers need to increase production through increased efficiency of resource use” Importance of feed efficiency to meet global meat demands Thomas E. Elam (Feedstuffs, 2004)
New technologies available to facilitate selection for improved feed efficiency • New feed efficiency traits that facilitate selection for improved efficiency independent of growth traits • Innovative RFID-based technology to cost-effectively measure feed intake, growth, feeding behavior traits in cattle • Discovery and validation of genetic markers that are linked to feed efficiency to facilitate gene marker-assisted selection
Attributes of an ideal feed efficiency trait for use in genetic selection programs Ideal feed efficiency trait for post-weaning bulls: • heritable and responds to selection • independent of growth and mature size • minimal genetic antagonisms with other economically relevant traits (e.g., carcass, milk, fertility) • reflect differences in cow efficiency • linked in biologically relevant traits associated with efficiency of feed utilization (e.g., digestibility, heat production)
Ratio-based feed efficiency traits--defined • Gross feed efficiency: ratio of live-weight gain to dry matter feed intake (DMI) • Feed conversion ratio (FCR): DMI to gain ratio • FCR is a gross efficiency measurement of efficiency in that it does not attempt to partition feed inputs into portions needed to support maintenance and growth requirements
Ratio-based feed efficiency traits • Feed:gain ratio is negatively correlated with: • Postweaning ADG (rg = -0.67; Koots et al., 1994) • Yearling BW (rg = -0.60; Koots et al., 1994) • Cow mature size (rg = -0.54; Archer et al., 2002) • Selection for lower feed:gain ratio (improved efficiency) will indirectly: • Increase genetic merit for growth • Increase cow mature size • Increase in feed costs for the cow herd
Partial efficiency of growth (PEG)--defined • PEG attempts to partition feed inputs into the portion used for growth • PEG = ADG ÷ DMI available for growth • DMI for growth = actual DMI - feed for required for maintenance • Feed for maintenance is computed from feeding standards (NRC, 1996) • PEG is moderately heritable (Arthur et al. 2001), and is not as strongly correlated to growth as FCR
Residual feed intake (RFI)--defined • RFI is a trait that measures the variation in feed intake beyond that needed to support maintenance and growth requirements (Koch et al., 1963) • RFI has been shown to moderately heritable (h2 ≈ 0.30 to 0.40) • Unlike feed:gain ratio, RFI is not genetically related to growth rate or mature size
How is RFI measured? • RFI is measured as the difference between an animal’s actual feed intake and the amount of feed an animal is expected to eat based on its size and growth rate • DMI = ß0 + ß1(mid-test BW.75) + ß2(ADG) + residual • Calves that eat less than expected for their weight and ADG will have negative RFI • Calves that eat more than expected for their weight and ADG will have positive RFI
Relationship between feed intake and growth in steers Ate more feed at same ADG Less efficient Ate less feed at same ADG More efficient
Comparison of steers with divergent RFI Performance data during an 77-day growing trial: 538 lbInitial body weight535 lb 2.11 lb/dADG2.16 lb/d 1502 lbExpected feed intake1509 lb 1717 lbActual feed intake1232 lb +215 lbResidual feed intake-277 lb The more efficient steer (negative RFI) gained the same, but ate 485 lbs less feed than the less efficient steer (positive RFI)
Relationships between feed intake and growth in growing and finishing calves-- Meta analysis results Growing calves (n = 514), Dry matter intake, lb/day Finishing calves (n = 320), Dry matter intake, lb/day
Relationships between feed efficiency and growth traits in growing and finishing calves--Meta analysis results
Relationships between feed efficiency traits and ADG in growing calves
Relationships between feed efficiency and intake traits in growing and finishing calves--Meta analysis results
Performance data of growing calves with low and high RFI† †Low and high RFI calves were ± 0.50 SD from average RFI (0.0 ± 1.80 lb/d))
Performance data of finishing calves with low and high RFI† †Low and high RFI calves were ± 0.50 SD from average RFI (0.0 ± 1.96 lb/d))
Relationships between feed efficiency and carcass traits in growing and finishing calves--Meta analysis results
Summary of phenotypic relationships between feed efficiency and component traits
Additional merits of RFI as an efficiency trait • RFI is less influenced by initial age & BW • RFI is less influenced by previous plane of nutrition • Post-weaning RFI more likely to be associated with efficiency in mature cows • RFI is more associated with biologically relevant traits associated with efficiency of feed utilization
Relationships between feed efficiency measured in growing heifers and mature cows • Efficiency traits measured in Angus heifers and mature open cows • Fed the same diet during post-weaning and mature cow studies • 751 females measured (Archer et al., 2002)
RFI is linked to biological traits associated with efficiency of feed utilization
Data Analysis: Networked TAMU computer for data acquisition & analysis Data Capture: Computer at BDC Commercialization of feed efficiency technologies Beef Development Center, Millican TX Pen 1 Pen 2 Each test pen equipped with nine feed bunks to facilitate 65-70 bulls GrowSafe feed bunks Weight & reader panels Feed alley Wireless communications data transfer
Summary statistics of the first two bull tests conducted at the Beef Development Center
Results from 1st feed efficiency test at the Beef Development Center
Multiple-trait selection index for growing bulls Feedlot Profit Index (FPI) Index objective: increase profitability of grow/finish market progeny Economic weighting factors: derived for DMI, ADG and slaughter weight data generated from 426 individually fed Charolais-cross steers (Alberta, Canada) Selection index development: constructed using data from 1st Beef Development Center test Feedlot profit index = b1•RFI + b2•ADG + b3•adj. 365-d YW = ranges from ≈ 80 to 120 = the higher the better Crews et al. (2005)
FPI = 93 FPI = 83 FPI = 106 FPI = 128 RFI of bulls from the 2nd BDC test (Fall 2004)
Performance data of low and high Feedlot Profit Index bulls from 2nd BDC test
Contributors to Research Program Texas Agriculture Experiment Station Ron Randel Monte Rouquette Charles Long David Forrest Luis Tedeschi Tom Welsh Rhonda Miller Casey Thies Monte White Trent Fox Erin Brown Phillip Lancaster Flavio Ribeiro Brandi Bourg David Forbes Bill Holloway
Thanks for your attention!Questions? Industry supporters: • Beef Development Center • Spade Ranch • Chapman Ranch • King Ranch • Camp Cooley Ranch • Vassberg Ranch Support for research: • TAES; Beef Initiative • TCFA • NCBA • SARE